T cell Activation Marker HLA-DR Reflects Tacrolimus-Associated Immunosuppressive Burden and BK Viremia Risk After Kidney Transplantation - An Observational Cohort Study
- PMID: 40747140
- PMCID: PMC12310561
- DOI: 10.3389/ti.2025.14443
T cell Activation Marker HLA-DR Reflects Tacrolimus-Associated Immunosuppressive Burden and BK Viremia Risk After Kidney Transplantation - An Observational Cohort Study
Abstract
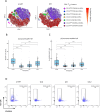
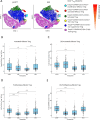
Kidney transplantation (KT) is the current treatment of choice in patients with end-stage kidney disease. Immunosuppression is required to prevent acute rejection but is associated with a high incidence of adverse events. The immunosuppressive burden substantially differs between individuals, necessitating new immune monitoring strategies to achieve personalization of immunosuppression. To compare the evolution of T cell profiles in correlation with immunosuppression and clinical outcomes, 87 kidney transplant recipients were followed for 12 months after KT. Flow cytometry along with assessment of T cell activation markers and clinical data was performed before KT and during study visits 10 days, 2 months and 12 months after KT. Longitudinal T cell phenotyping revealed a significant decrease of T cell activation markers HLA-DR, FCRL3, and CD147 in CD4+ effector T cells after KT. The most pronounced reduction (75%) was found for the activation-proliferation marker HLA-DR, which persisted throughout the observational period. The decrease in HLA-DR expression reflected immunosuppressive burden through strong associations with tacrolimus trough-level exposure (coeff = -0.39, p < 0.01) and BK viremia incidence (coeff = -0.40, p < 0.01) in multivariable regression analysis. T cell activation marker HLA-DR emerges as a potential biomarker for tacrolimus-related immunosuppressive burden in association with BK viremia risk following KT.
Keywords: immune monitoring; immunosuppression; kidney transplantation; personalized medicine; translational nephrology.
Copyright © 2025 Aberger, Schuller, Mooslechner, Klötzer, Prietl, Pfeifer, Kirsch, Rosenkranz, Artinger and Eller.
Conflict of interest statement
KE received an investigator-initiated research grant by Chiesi, congress-support and speaker fees by Chiesi and Astellas. The remaining authors declare that the research was conducted in the absence of any commercial or financial relationships that could be construed as a potential conflict of interest.
Figures


Similar articles
-
Association of BKV viremia and nephropathy with adverse alloimmune outcomes in kidney transplant recipients.Clin Transplant. 2024 May;38(5):e15329. doi: 10.1111/ctr.15329. Clin Transplant. 2024. PMID: 38722085
-
Interventions for BK virus infection in kidney transplant recipients.Cochrane Database Syst Rev. 2024 Oct 9;10(10):CD013344. doi: 10.1002/14651858.CD013344.pub2. Cochrane Database Syst Rev. 2024. PMID: 39382091
-
Tacrolimus versus cyclosporin as primary immunosuppression for lung transplant recipients.Cochrane Database Syst Rev. 2013 May 31;2013(5):CD008817. doi: 10.1002/14651858.CD008817.pub2. Cochrane Database Syst Rev. 2013. PMID: 23728681 Free PMC article.
-
Belatacept for kidney transplant recipients.Cochrane Database Syst Rev. 2014 Nov 24;2014(11):CD010699. doi: 10.1002/14651858.CD010699.pub2. Cochrane Database Syst Rev. 2014. PMID: 25416857 Free PMC article.
-
Steroid avoidance or withdrawal for pancreas and pancreas with kidney transplant recipients.Cochrane Database Syst Rev. 2014 Sep 15;2014(9):CD007669. doi: 10.1002/14651858.CD007669.pub2. Cochrane Database Syst Rev. 2014. PMID: 25220222 Free PMC article.
References
-
- Thomusch O, Wiesener M, Opgenoorth M, Pascher A, Woitas RP, Witzke O, et al. Rabbit-ATG or Basiliximab Induction for Rapid Steroid Withdrawal after Renal Transplantation (Harmony): An Open-Label, Multicentre, Randomised Controlled Trial. Lancet (2016) 388(10063):3006–16. 10.1016/s0140-6736(16)32187-0 - DOI - PubMed
Publication types
MeSH terms
Substances
LinkOut - more resources
Full Text Sources
Medical
Research Materials

