. 2025 Jul 17:16:1620032.
doi: 10.3389/fendo.2025.1620032. eCollection 2025.

Bioinformatic analysis identifies LPL as a critical gene in diabetic kidney disease via lipoprotein metabolism

Affiliations

Bioinformatic analysis identifies LPL as a critical gene in diabetic kidney disease via lipoprotein metabolism

Qian Dong et al. Front Endocrinol (Lausanne). .

Abstract

Background: Diabetic kidney disease (DKD) is a common and serious complication of diabetes, affecting approximately 40% of patients with the condition. The pathogenesis of DKD is complex, involving multiple processes such as metabolism, inflammation, and fibrosis. Given its increasing incidence and associated mortality, there is an urgent need to identify novel pathogenic genes and therapeutic targets.

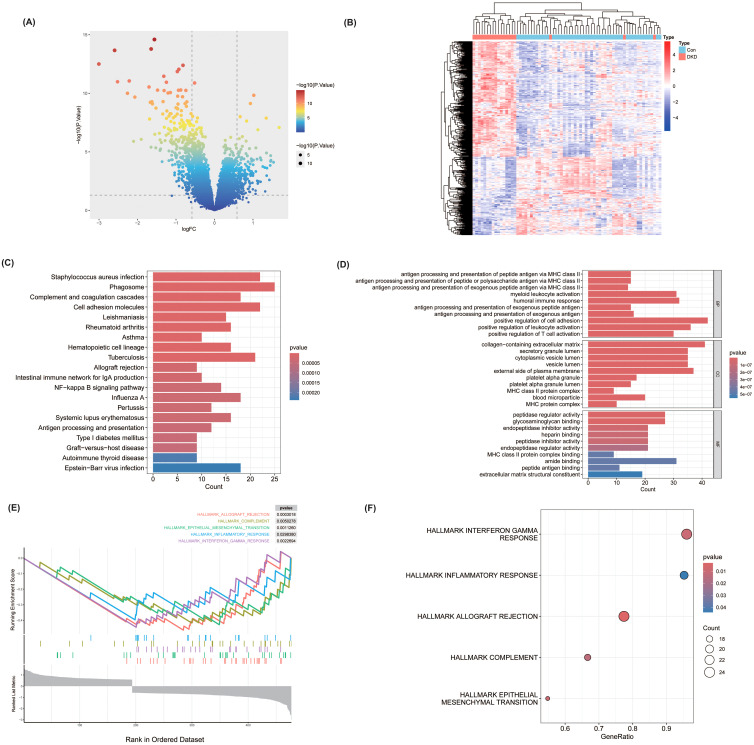
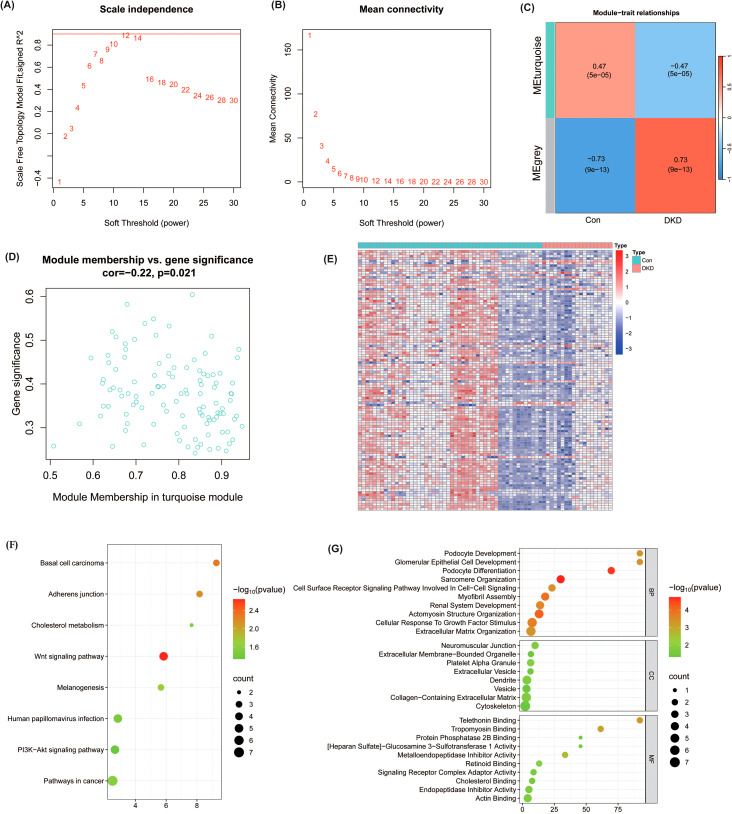
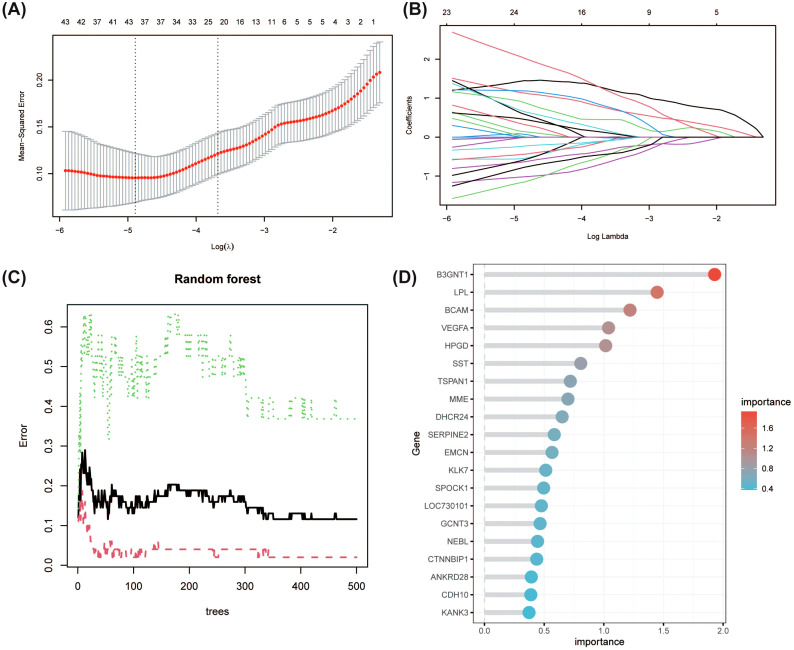
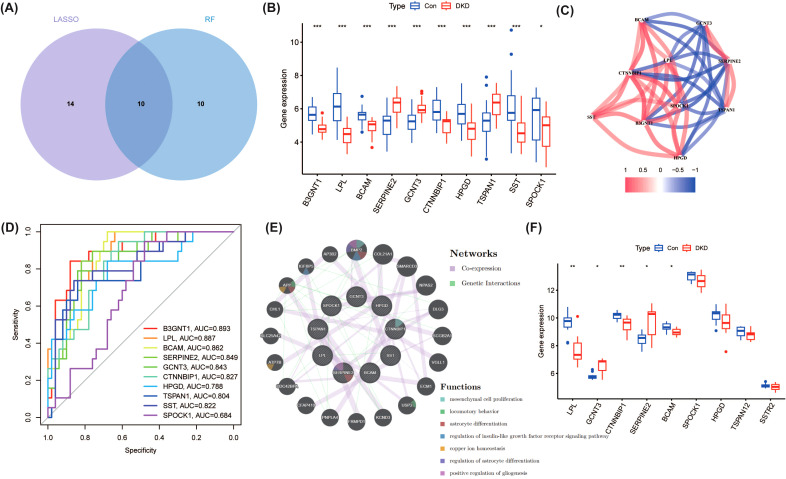
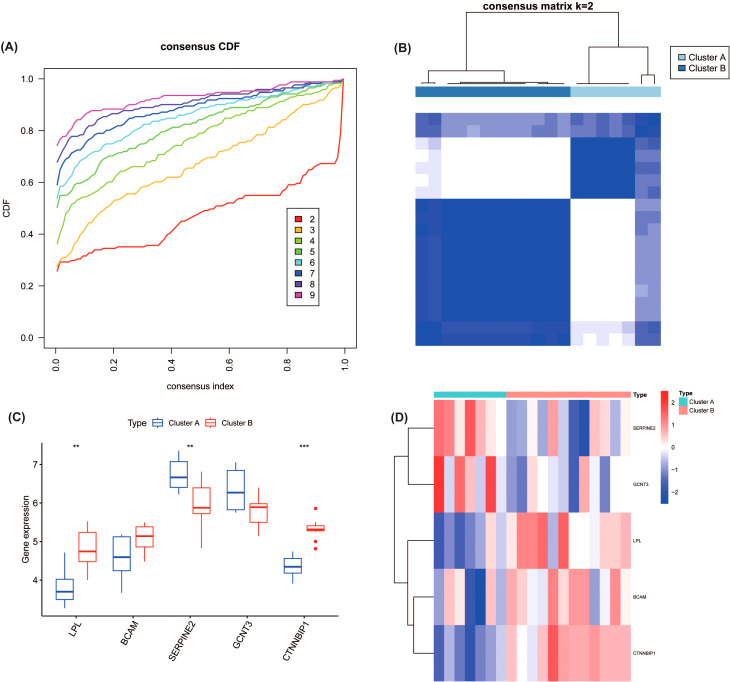
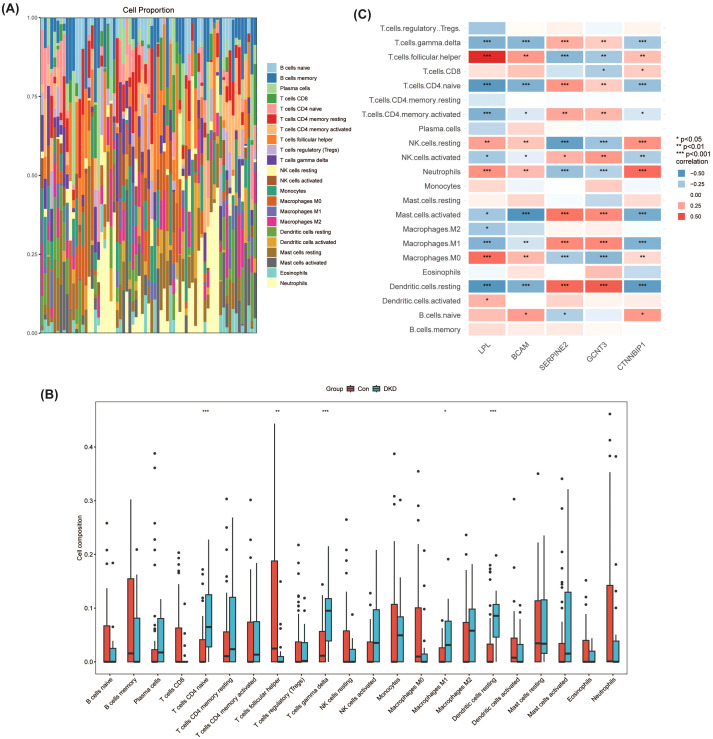
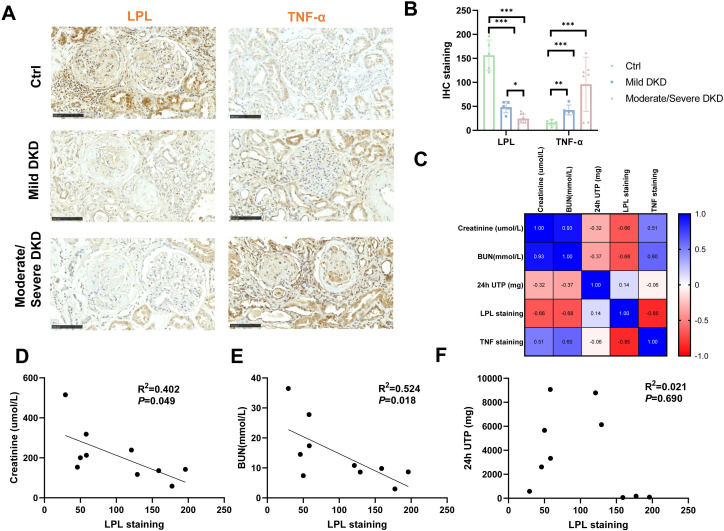
Methods: This study systematically identified hub DKD-associated genes and their potential molecular mechanisms through bioinformatic analysis. Gene expression datasets from DKD patients and healthy controls were obtained from the GEO database. Hub genes were screened using differential expression analysis, weighted gene co-expression network analysis (WGCNA), LASSO regression, random forest (RF) algorithms, and consensus clustering for DKD patient classification. Additionally, immune cell infiltration analysis was performed on differentially expressed genes to explore the relationship between hub genes and the immune microenvironment. Potential drugs targeting LPL were predicted based on gene-drug interaction analysis. Immunohistochemistry was used to verify the expression of LPL and TNF-α in kidney tissues from patients with varying degrees of DKD severity, as well as their relationship with kidney function impairment.

Results: This study revealed that LPL, a lipoprotein metabolism gene, plays a crucial role in DKD, participating in cholesterol and glycerolipid metabolism as well as PPAR signaling. LPL expression was negatively correlated with pro-inflammatory M1 macrophages and various subsets of T cells, including naïve CD4 T cells and gamma delta T cells, while positively correlated with follicular helper T cells, suggesting its immune-regulation effects in DKD progression. Potential LPL-targeting drugs, such as Ibrolipim, anabolic steroid, and acarbose, might mitigate DKD. LPL expression was decreased with DKD severity and was correlated with TNF-α and kidney dysfunction markers, indicating its key role in DKD progression.

Conclusion: LPL is a pivotal regulator of lipid metabolism and immune inflammation in DKD. Potential drugs targeting LPL offer new candidates for precision treatment of DKD. These findings lay a theoretical foundation for understanding the molecular mechanisms of DKD and developing LPL-based therapeutic strategies.

Keywords: bioinformatic; diabetic kidney disease; immune cell infiltration; lipid metabolism; lipoprotein lipase.


Conflict of interest statement

The remaining authors declare that the research was conducted in the absence of any commercial or financial relationships that could be construed as a potential conflict of interest.

Figures

Figure 1
Figure 1
Differentially expressed genes (DEGs) analysis and enrichment results in DKD patients versus healthy controls. (A) Volcano plot of DEGs identified in the GSE30122 dataset based on the criteria |log2FC| > 0.585 and P < 0.05 in diabetic kidney disease (DKD) patients compared to controls. (B) Heatmap showing the expression levels of selected DEGs in DKD and control groups. (C) KEGG pathway enrichment analysis of DEGs. (D) GO enrichment analysis illustrating DEGs significantly associated with biological processes (BP), molecular functions (MF), and cellular components (CC). (E, F) Gene Set Enrichment Analysis (GSEA) of DEGs.
Figure 2
Figure 2
Weighted Gene Co-expression Network Analysis (WGCNA) of DEGs in DKD patients and control samples. (A, B) Scale-free topology model fit index as a function of the soft-thresholding power. A soft-thresholding power of 12 was chosen to ensure scale-free topology in the network construction. (C) Module-trait relationships showing a significant association between the turquoise module and DKD (r = 0.47, P = 5e-05). (D) Scatter plot of module membership versus gene significance for genes in the turquoise module, with a notable correlation (r = -0.22, P = 0.021). (E) Heatmap depicting the expression levels of genes within the turquoise module across DKD and control samples. (F, G) Functional enrichment analysis of genes in the turquoise module via KEGG and GO analysis.
Figure 3
Figure 3
Identification of key predictive genes using LASSO regression and Random Forest (RF) analysis. (A) LASSO regression model with 5-fold cross-validation to select the optimal regularization parameter (λ). The minimum mean squared error was used to determine the optimal λ value, resulting in the selection of key predictive genes. (B) LASSO coefficient profiles for each gene as a function of the regularization parameter λ. Genes with non-zero coefficients at the optimal λ were identified as key genes. (C) RF analysis showing the error rate as a function of the number of decision trees. (D) Top 20 genes ranked by importance score (Mean Decrease Gini) in the RF analysis.
Figure 4
Figure 4
Integrated analysis of hub genes identified by LASSO and RF models in DKD. (A) Venn diagram depicting 10 overlapping genes identified by both LASSO and RF analyses. (B) Expression levels of the overlapping genes in DKD and control samples. *P<0.05, ***P<0.001. (C) Correlation analysis of the expression levels of the 10 overlapping genes. (D) Receiver Operating Characteristic (ROC) analysis for each gene. (E) Gene-gene interaction network generated via the GENEMANIA database. (F) Validation (GSE104948) of gene expression in an independent dataset identified five hub genes (LPL, BCAM, SERPINE2, GCNT3, and CTNNBIP1) closely associated with DKD. *P<0.05, **P<0.01.
Figure 5
Figure 5
Consensus clustering analysis of five hub genes in DKD patients. (A) Consensus matrix for clustering, showing optimal stability at k=2, resulting in two molecular subtypes (Type A and Type B) based on the expression of hub genes. (B) Cumulative Distribution Function (CDF) curve for consensus clustering with different values of k. (C) Expression levels of the hub genes (LPL, BCAM, SERPINE2, GCNT3, and CTNNBIP1) in the two identified subtypes. ***P<0.001 (D) Heatmap of gene expression between Type A and Type B. **P<0.01.
Figure 6
Figure 6
Analysis of immune cell composition and hub gene immune associations in DKD using CIBERSORT. (A) Proportional distribution of immune cell types in DKD patients and healthy controls (Control group). (B) Comparative analysis of immune cell infiltration in DKD and control groups. *P<0.05, **P<0.01, ***P<0.001. (C) Correlation analysis of hub genes (LPL, BCAM, SERPINE2, GCNT3, and CTNNBIP1) with various immune cell types. *P<0.05, **P<0.01, ***P<0.001.
Figure 7
Figure 7
Immunohistochemical analysis of LPL and TNF-α expression in relation to DKD severity. (A) Representative immunohistochemical staining of LPL and TNF-α in kidney tissues from control, mild DKD, and moderate/severe DKD patients (scale bar = 100 μm). (B) Quantitative analysis of LPL and TNF-α staining intensities among the control, mild DKD, and moderate/severe DKD groups. *P < 0.05, **P < 0.01, ***P < 0.001. (C) Correlation matrix of LPL and TNF-α staining intensities with kidney function indicators (serum creatinine, urea nitrogen, and 24-hour urinary protein). (D) Linear regression analysis of LPL staining intensity with serum creatinine levels. (E) Linear regression analysis of LPL staining intensity with urea nitrogen levels. (F) Linear regression analysis of LPL staining intensity with 24-hour urinary protein levels.

Similar articles

References

    1. Zhang Y, Zhao L, Jia Y, Zhang X, Han Y, Lu P, et al. Genetic evidence for the causal relationship between gut microbiota and diabetic kidney disease: A bidirectional, two-sample mendelian randomisation study. J Diabetes Res. (2024) 2024:4545595. doi: 10.1155/2024/4545595, PMID: - DOI - PMC - PubMed
    1. Chadban SJ, Briganti EM, Kerr PG, Dunstan DW, Welborn TA, Zimmet PZ, et al. Prevalence of kidney damage in Australian adults: The AusDiab kidney study. J Am Soc Nephrol JASN. (2003) 14:S131–138. doi: 10.1097/01.asn.0000070152.11927.4a, PMID: - DOI - PubMed
    1. Horton WB, Barrett EJ. Microvascular dysfunction in diabetes mellitus and cardiometabolic disease. Endocr Rev. (2020) 42:29. doi: 10.1210/endrev/bnaa025, PMID: - DOI - PMC - PubMed
    1. Amorim RG, Guedes G da S, Vasconcelos SM de L, Santos JC de F. Kidney disease in diabetes mellitus: cross-linking between hyperglycemia, redox imbalance and inflammation. Arq Bras Cardiol. (2019) 112:577. doi: 10.5935/abc.20190077, PMID: - DOI - PMC - PubMed
    1. Fermín-Martínez CA, Bello-Chavolla OY, Paz-Cabrera CD, Ramírez-García D, Perezalonso-Espinosa J, Fernández-Chirino L, et al. Prediabetes as a risk factor for all-cause and cause-specific mortality: a prospective analysis of 115,919 adults without diabetes in Mexico City. MedRxiv Prepr Serv Health Sci. (2024), 2024.04.15.24305840. doi: 10.1101/2024.04.15.24305840, PMID: - DOI - PMC - PubMed