. 2025 Jul 26:20:2601-2614.
doi: 10.2147/COPD.S528703. eCollection 2025.

Screening and Verification COPD-OSA Overlap Syndrome Core Genes Using Bioinformatics

Affiliations

Screening and Verification COPD-OSA Overlap Syndrome Core Genes Using Bioinformatics

Shihao Qiang et al. Int J Chron Obstruct Pulmon Dis. .

Abstract

Background: When obstructive sleep apnea (OSA) and chronic obstructive pulmonary disease (COPD) coexist in a patient, it is called overlap syndrome (OS). However, the molecular mechanisms underpinning OS are unclear. To address this, we explored potential OS mechanisms using bioinformatics.

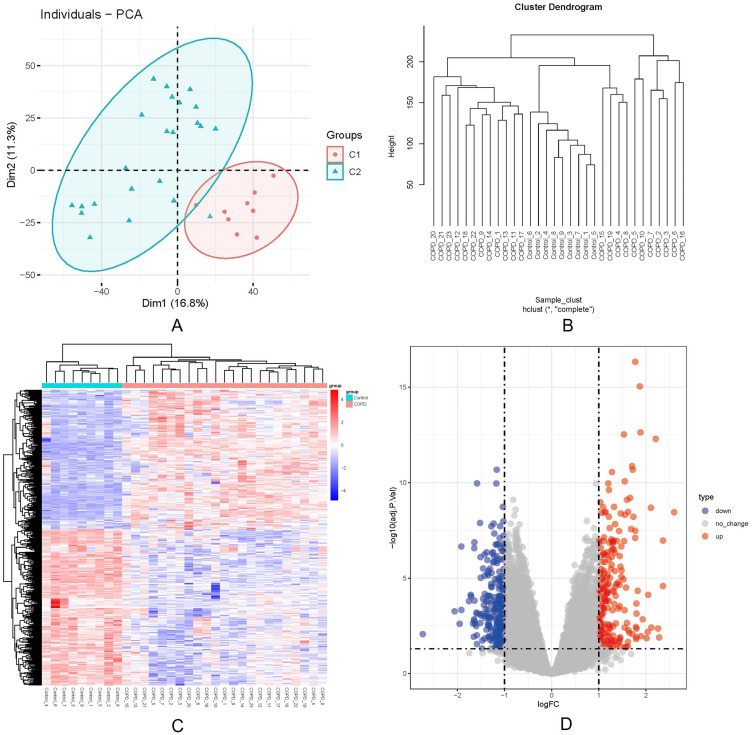
Methods: OSA and COPD gene expression datasets were obtained from the Gene Expression Omnibus (GEO) database. Differential expression and weighted gene co-expression network analyses (WGCNA) were performed to identify common differentially expressed genes (DEGs) in OSA and COPD, and perform functional enrichment analysis. DEGs were validated in an external COPD gene expression dataset using receiver operating characteristic (ROC) curves and box plots. Positive results were initially identified as core genes, and were then validated by analyzing core genes in healthy controls, patients with OSA alone and patients with OS using RT-qPCR.

Results: Through differential expression gene analysis, 9 common DEGs for OSA and COPD were identified. Through WGCNA analysis, 128 common key module genes for OSA and COPD were identified. By taking the intersection of the identified 9 DEGs and the 128 common key module genes from WGCNA, 5 key genes were determined. Preliminary validation in the external gene expression dataset for COPD revealed that GRM8 was a potential hub gene for OS. Compared with the control group, the expression of GRM8 was significantly downregulated in the COPD group (P = 0.019). The diagnostic value was evaluated using the ROC curve, and the results showed that the AUC was 0.857 (95% CI: 0.614-1.000). Finally, RT-qPCR confirmed that the expression levels of GRM8 in OSA and OS were significantly lower than those in the healthy control group (P < 0.05), and it was a hub gene significantly associated with OS.

Conclusion: Our research identified hub gene that may provide new directions for further mechanistic research on OS.

Keywords: GRM8; bioinformatics; chronic obstructive pulmonary disease; glutamate metabotropic receptor 8; obstructive sleep apnea; overlap syndrome.


Conflict of interest statement

The authors declare no conflicts of interest.

Figures

Figure 1
Figure 1
Differentially expressed gene identification in GSE135917. (A) Principal Component Analysis results, with red C1 representing the normal control group and green C2 representing the OSA group. (B) Sample clustering results. (C) Heatmap showing expression levels gradually increasing from blue to red. (D) Volcano plot, with blue on the left indicating down-regulated genes and red on the right indicating up-regulated genes. The dashed line above the vertical axis represents P<0.05, and the two dashed lines on the horizontal axis represent |log FC| ≥ 1.
Figure 2
Figure 2
Differentially expressed gene identification in GSE38974. (A) Principal component analysis results, red C1 represents the normal control group, and green C2 represents the COPD group. (B) Sample clustering results. (C) Heatmap showing expression levels gradually increasing from blue to red. (D) Volcano plot, with blue on the left indicating down-regulated genes and red on the right indicating up-regulated genes. The dashed line above the vertical axis represents P<0.05 and the two dashed lines on the horizontal axis represent |logFC| ≥ 1.
Figure 3
Figure 3
Venn diagram showing differentially expressed genes between OSA and COPD groups. Different colors represent up- and down-regulated differentially expressed genes in OSA and COPD groups, respectively, and the numbers represent intersecting genes.
Figure 4
Figure 4
Weighted gene co-expression network analysis of GSE135917. (A) Module trait relationship heatmap. (B) Hierarchical clustering map. (C) The left panel shows the determination of the optimal soft threshold, and the right panel shows the network connections under various soft thresholds.
Figure 5
Figure 5
Weighted gene co-expression network analysis of GSE38974. (A) Module trait relationship heatmap. (B) Hierarchical clustering map. (C) The left panel shows the determination of the optimal soft threshold, and the right panel shows the network connections under various soft thresholds.
Figure 6
Figure 6
Venn diagram showing weighted gene co-expression network analysis intersection results for GSE135917 and GSE38974 datasets. The green circle (left) represents OSA dataset results and the blue circle (right) represents COPD dataset results.
Figure 7
Figure 7
Functional enrichment analysis. (A) Gene Ontology pathway enrichment analysis of key module genes shared by OSA and COPD. The color changes in the bubble chart correspond to different P-values, with different shapes representing biological processes, cellular components, and molecular functions. Bubble size represents the number of genes. (B) The bubble plot shows the Kyoto Encyclopedia of Genes and Genomes pathways involved in OS, with bubble size indicating gene numbers.
Figure 8
Figure 8
Venn diagram showing common key module gene and common DEGs intersection in WGCNA. The green circle (left) represents WGCNA intersection genes and the blue circle (right) represents DEG intersections.
Figure 9
Figure 9
Verification of the external COPD dataset (GSE106986). (A) Box plot. Blue represents COPD group, red represents normal control group. (B) ROC curve of the hub diagnostic genes.
Figure 10
Figure 10
Clinical sample validation results. GRM8 expression differences between healthy control, OSA, COPD, and OS groups. Vertical axis: Relative mRNA expression of GRM8.

Similar articles

References

    1. Lévy P, Kohler M, McNicholas WT, et al. Obstructive sleep apnoea syndrome. Nat Rev Dis Primers. 2015;1:15015. doi: 10.1038/nrdp.2015.15 - DOI - PubMed
    1. Global Initiative for Chronic Obstructive Lung Disease (GOLD). Global Strategy for Prevention, Diagnosis and Management of COPD: 2025 Report. Bethesda: GOLD; 2025.
    1. Flenley DC. Sleep in chronic obstructive lung disease. Clin Chest Med. 1985;6(4):651–661. doi: 10.1016/S0272-5231(21)00402-0 - DOI - PubMed
    1. Senaratna CV, Perret JL, Lodge CJ, et al. Prevalence of obstructive sleep apnea in the general population: a systematic review. Sleep Med Rev. 2017;34:70–81. doi: 10.1016/j.smrv.2016.07.002 - DOI - PubMed
    1. Shawon MS, Perret JL, Senaratna CV, Lodge C, Hamilton GS, Dharmage SC. Current evidence on prevalence and clinical outcomes of co-morbid obstructive sleep apnea and chronic obstructive pulmonary disease: a systematic review. Sleep Med Rev. 2017;32:58–68. doi: 10.1016/j.smrv.2016.02.007 - DOI - PubMed

MeSH terms

Substances

LinkOut - more resources