. 2025 Aug;36(8):e70156.
doi: 10.1111/pai.70156.

Impact of oral immunotherapy on diversity of gut microbiota in food-allergic children

Affiliations

Impact of oral immunotherapy on diversity of gut microbiota in food-allergic children

Thanina Bouabid et al. Pediatr Allergy Immunol. 2025 Aug.

Abstract

Background: Food allergies (FAs) are an increasing public health concern, particularly in children. Oral immunotherapy (OIT) is an emerging treatment strategy under clinical investigation for desensitization of children with FA to food allergens. Dysbiosis of the gut microbiota has been implicated in FAs, and various factors influence its composition; however, the impact of OIT on the gut microbiota remains largely unexplored.

Objective: This study aimed to identify the changes in diversity of the gut microbiota following OIT in children with FA.

Methods: Thirty children with FA (mean age 3.93 years, age range 2.00-14.00) undergoing oral immunotherapy targeting legumes (lentils, peanuts, peas), tree nuts (cashews, hazelnuts, pistachios), animal products (milk, egg), and fish and shellfish (salmon, shrimp), as well as seven non-allergic controls (mean age 2.65 years, age range 0.25-5.00) participated in this study. Fecal samples were collected before and after OIT from children with FA, and once from controls. The gut microbiota was profiled using 16S rRNA sequencing, followed by diversity and differential abundance analyses. Alpha and beta diversities were compared, and differential abundance was assessed.

Results: Beta diversity analysis revealed small but significant differences in microbial composition between children with FA before and after OIT, and between controls and children with FA before OIT. Differential abundance analysis showed that OIT induced a reversion of the abundance levels of Bacteroidota and Verrucomicrobiota toward those observed in controls.

Conclusion: To our knowledge, this is the first study to investigate the impact of OIT on the gut microbiota in children with different FAs for identifying potential microbial biomarkers and convincingly demonstrated their interrelation. These findings may help improve and personalize FA treatment.

Keywords: bacteroidota; children; food allergy; gut microbiota; oral immunotherapy; verrucomicrobiota.


Conflict of interest statement

The authors declare no conflict of interest in relation to this study.

Figures

FIGURE 1
FIGURE 1
Schematic of the study design. The analysis steps include comparisons of alpha and beta diversities and identification of intestinal microbial taxa with differential abundance (1) between children with FA before (T0 FA) and after (T1 FA) the updosing phase of oral immunotherapy and (2) between controls and the T0 FA group. Finally, (3) comparisons were made between differently abundant taxa identified in the two previous comparisons for assessing if OIT induces a reversion of certain taxa to normal abundance levels.
FIGURE 2
FIGURE 2
Description of FA profile among allergic children. (A) The frequency related to the number of food allergens leading to allergic reaction for each child. (B) Types of food allergens in allergic children. (C) Food allergens targeted by desensitization in allergic children. (Nuts ‐ cashews, hazelnuts, and pistachios; legumes—lentils, peanuts, and peas; Animal products—egg, milk; fish and shellfish—salmon, shrimp).
FIGURE 3
FIGURE 3
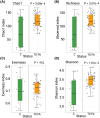
Alpha diversity between controls (C, green) and children with FA before oral immunotherapy (T0 FA, orange) measured by (A) Chao1 index, (B) observed index, (C) evenness index, and (D) Shannon index. Boxes represent quartiles, illustrating the largest distribution of both sample groups, with the line showing the median. The p‐values were calculated using linear models (p < .05). Three out of four alpha diversity metrics showed significant differences, while evenness (C) was non‐significant (N.S.), as indicated in the figure.
FIGURE 4
FIGURE 4
Plots showing Bray–Curtis dissimilarity in principal coordinate analysis (PCoA) space for samples of (A) children with FA before and after the updosing phase of OIT and (B) children with FA before OIT and controls. Three different shades of orange, from lightest to darkest, represent children with FA before OIT (T0 FA): Light orange for those who reached complete desensitization (CoD), medium orange for clinical desensitization (ClD), and dark orange to represent children who achieved clinical desensitization for one allergen and complete desensitization for the other (ClD_CoD). Three different shades of blue, from lightest to darkest, represent children with FA after OIT (T1 FA) with the same clinical categories. Green circles represent controls (C). Triangles of the same colors represent their replicates. Gray connecting lines link paired T0‐T1 samples from the same subject in panel A and connect samples to their technical replicates in both panels.
FIGURE 5
FIGURE 5
Phyla with significant differences in abundance levels. (A) Barplots showing significant log (fold changes) (LFC; y‐axis) by bacterial phyla (x‐axis) generated using ANCOM‐BC test with significance threshold set to false discovery rate (FDR) < 0.05 for the comparison between allergic children before (T0 FA) and after (T1 FA) the updosing phase of the OIT groups. Orange bars represent the bacterial phyla more abundant in the T0 FA group than in the T1 FA group (negative LFC values). (B) Significant LFCs of bacterial phyla between the control and T0 FA groups. Orange bars represent bacterial phyla more abundant in the T0 FA group than in the control group (positive LFC values). (C) Abundance of the phylum Bacteroidota across the three groups: Controls (C), T0 FA, and T1 FA. (D) Abundance of the phylum Verrucomicrobiota across the three groups: C, T0 FA, and T1 FA. The p‐values for C and D were derived from ANCOM‐BC analyses with Bonferroni correction for significance threshold (α = 0.0167 for three comparisons).

References

    1. Seth D, Poowutikul P, Pansare M, Kamat D. Food allergy: a review. Pediatr Ann. 2020;49:e50‐e58. - PubMed
    1. Cosme‐Blanco W, Arroyo‐Flores E, Ale H. Food Allergies. Pediatr Rev. 2020;41:403‐415. - PubMed
    1. Peters RL, Krawiec M, Koplin JJ, Santos AF. Update on food allergy. Pediatr Allergy Immunol. 2021;32:647‐657. - PMC - PubMed
    1. Cheng Y, Liu X, Chen F, et al. The roles and mechanisms of gut microbiota in food allergy. Adv Gut Microb Res. 2023;2023:1‐16.
    1. Kazmi W, Berin MC. Oral tolerance and oral immunotherapy for food allergy: evidence for common mechanisms? Cell Immunol. 2023;383:104650. - PubMed