. 2025 Aug 1:14:RP105585.
doi: 10.7554/eLife.105585.

Loss of olfaction reduces caterpillar performance and increases susceptibility to a natural enemy

Affiliations

Loss of olfaction reduces caterpillar performance and increases susceptibility to a natural enemy

Qi Wang et al. Elife. .

Abstract

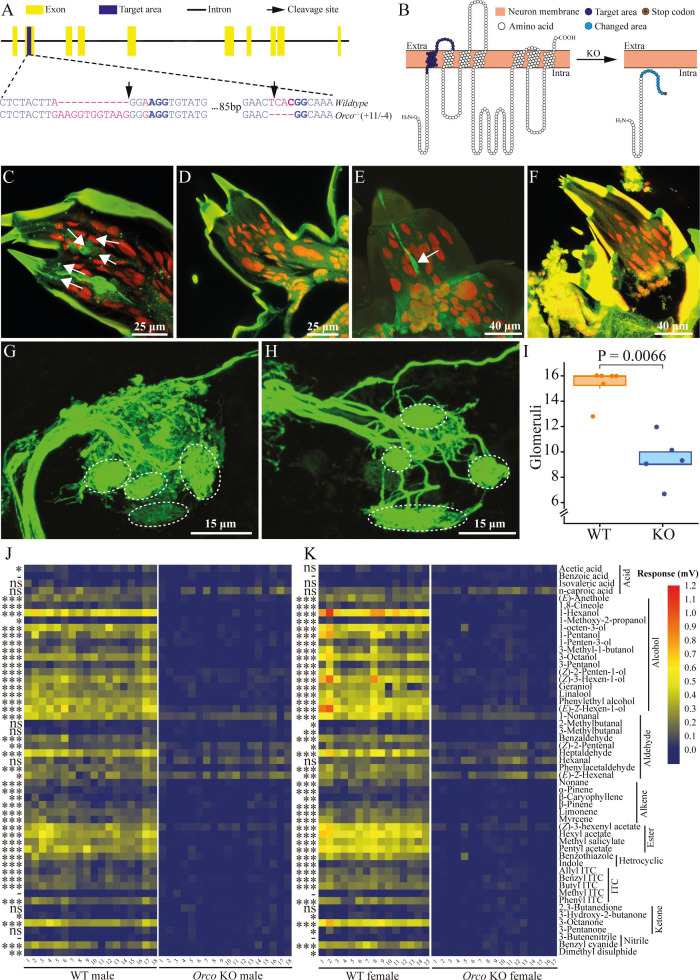
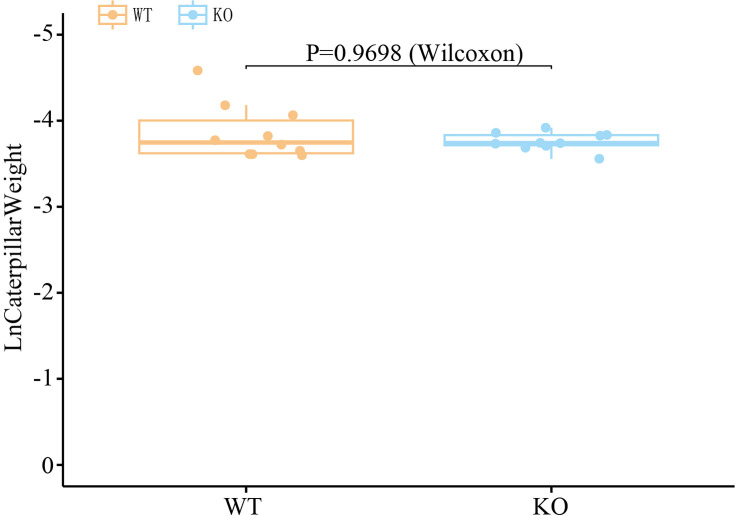
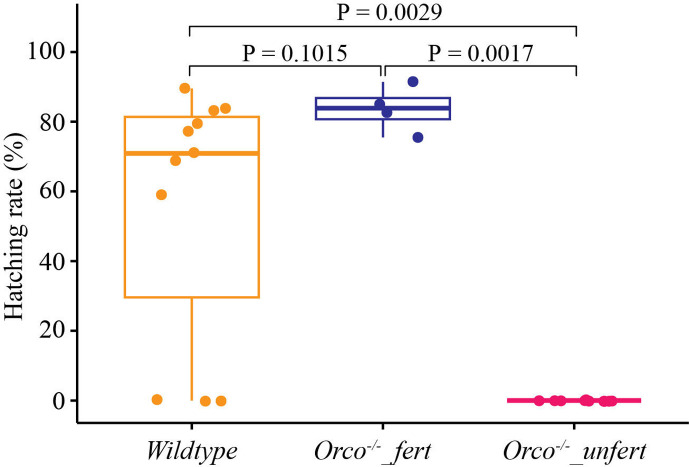
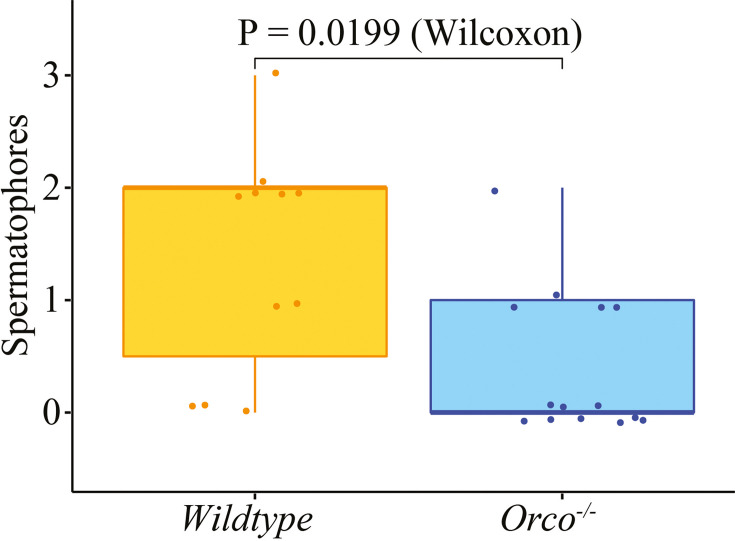
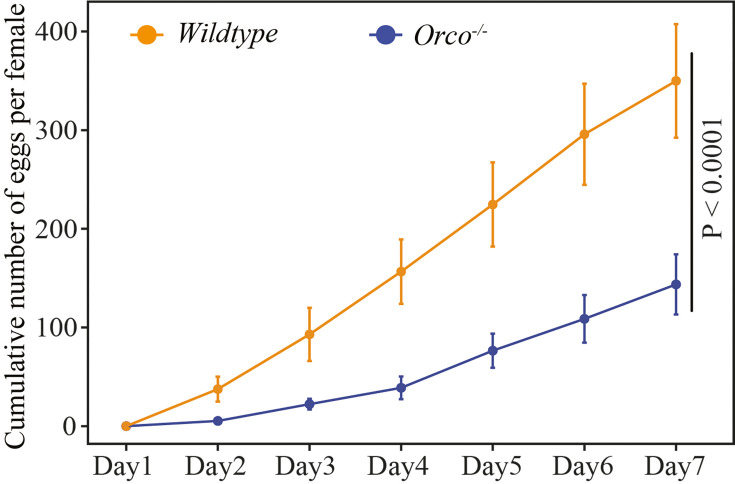
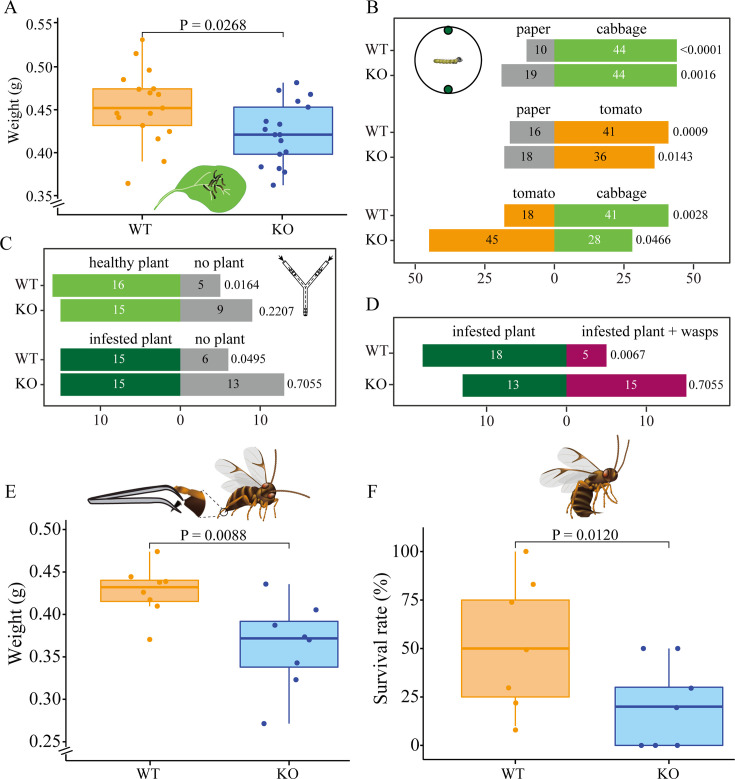
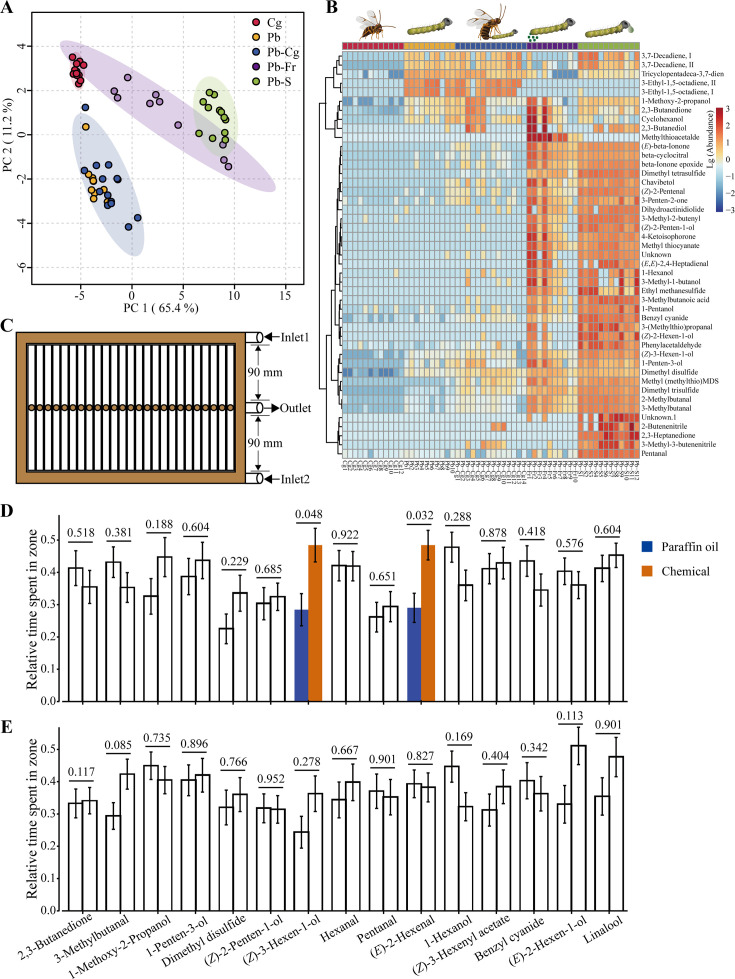
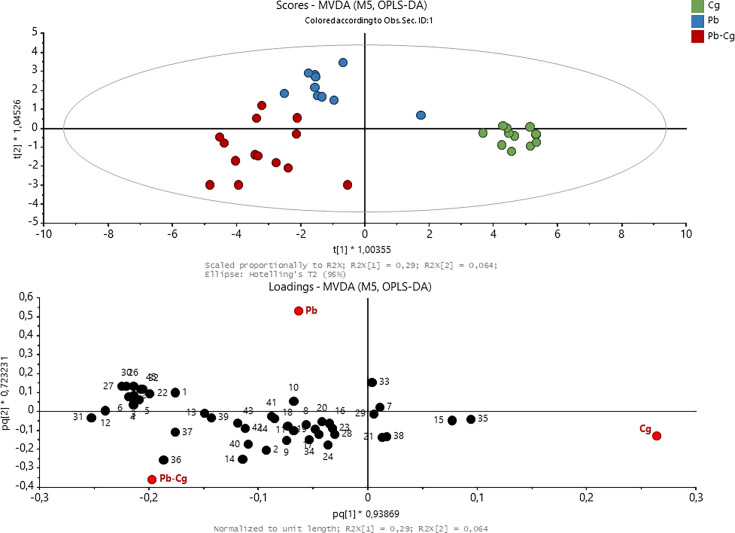
Insect herbivores such as caterpillars are under strong selection pressure from natural enemies, especially parasitoid wasps. Although the role of olfaction in host-plant seeking has been investigated in great detail in parasitoids and adult lepidopterans, the caterpillar olfactory system and its significance in tri-trophic interactions remain poorly understood. In this study, we investigated the olfactory system of Pieris brassicae caterpillars and the importance of olfactory information in the interactions among this herbivore, its host-plant Brassica oleracea, and its primary natural enemy Cotesia glomerata. To examine the role of olfaction, we utilized CRISPR/Cas9 to knockout (KO) the odorant receptor co-receptor (Orco). This KO impaired olfactory detection and primary processing in the brain. Orco KO caterpillars exhibited reduced weight and lost preference for their optimal food plants. Interestingly, the KO caterpillars also experienced reduced weight when challenged by the parasitoid C. glomerata whose ovipositor had been removed, and the mortality of the KO caterpillars under the attack of unmanipulated parasitoids increased. We then investigated the behavior of P. brassicae caterpillars in response to volatiles from plants attacked by conspecific caterpillars and volatiles from plants on which the caterpillars were themselves attacked by C. glomerata. After analyzing the volatile compounds involved in these interactions, we concluded that olfactory information enables caterpillars to locate suitable food sources more efficiently as well as to select enemy-free spaces. Our results reveal the crucial role of olfaction in caterpillar feeding and natural-enemy avoidance, highlighting the significance of chemoreceptor genes in shaping ecological interactions.

Keywords: Orco; ecology; host-plant selection; insect larvae; multitrophic interactions; natural enemy; olfaction.

Plain language summary

Many caterpillars are major pests in agriculture, feeding on a variety of crops. They constantly face threats from both predators and the toxic defenses of the plants they eat. While scientists have long studied how predators find their prey, much less is known about how prey – like caterpillars – manage to survive and defend themselves. Plants have evolved various strategies to fend off insects. When attacked by herbivores, some plants release specific chemical signals known as herbivore-induced plant volatiles. These scents act as a distress call, attracting natural enemies of the herbivores, such as parasitoid wasps, which use the caterpillars for reproduction, killing the herbivores in the process. In turn, caterpillars have evolved different defense strategies. They have a sophisticated sense of smell, which may help them detect not only the scent of host plants but also the presence of predators or other caterpillars nearby. Despite how common and important caterpillars are in farming systems, it is still not fully understood how they choose where to feed or how they avoid being eaten. To explore this, Wang et al. studied how much caterpillars rely on their sense of smell to survive and find food. In insects, the ability to smell relies on a group of sensory proteins, most of which need a key gene called Orco to function. Without this gene, an insect’s ability to smell is severely impaired. Wang et al. used a gene editing tool known as CRISPR/Cas9 to ‘turn off’ the Orco gene in caterpillars of the large cabbage white butterfly (Pieris brassicae), effectively disabling their sense of smell. The researchers then compared the development, survival performance, and behavioral preferences of these mutant caterpillars with normal ones. This revealed that caterpillars without a working sense of smell gained less weight and were less successful at finding suitable food sources. They were also more likely to be killed by parasitoid wasps. Behavioral experiments showed that caterpillars with an intact Orco gene avoided plants where other caterpillars were under attack by detecting the warning signals in the air. In contrast, mutant caterpillars could not recognize these danger cues and were unable to find suitable host plants or select enemy-free spaces. The study of Wang et al. shows that caterpillars use smell not only to find food, but also to avoid danger. These insights could help farmers develop new, environmentally friendly ways to manage pests. For example, by planting companion plants that produce specific scents, or by breeding crops that naturally repel pests, we might be able to steer caterpillars away from valuable crops without relying on chemical pesticides.


Conflict of interest statement

QW, YJ, HS, BW, LG, MJ, MD, AH No competing interests declared

Figures

Figure 1.
Figure 1.. Orco knockout (KO) by CRISPR/Cas9 and verification in Pieris brassicae.
(A) Gene structure of Orco. Yellow blocks indicate exons, and blue blocks indicate target areas in the second exon. Black solid line indicates intron. Black arrows indicate the designated cleavage site of the Cas9 protein. The target KO area is magnified to show the sequence. Blue letters indicate base pairs in the second exon segment, purple letters indicate mutation sites. Protospacer adjacent motif (PAM) sequences are in blue bold. (B) Predicted transmembrane structure of Orco. The left and right panels represent wildtype (WT) Orco and mutated Orco transmembrane domains, respectively. Orange blocks indicate odorant receptor neuron (ORN) membrane, extracellular (Extra), and intracellular (Intra) are shown. White circles indicate amino acids of Orco, blue circles on the left panel indicate the target mutation area. Cyan circles and the brown circle on the right panel indicate the mutated area and the early stop codon, respectively. Orco-positive ORNs and larval antennal center (LAC). P. brassicae larval antennae and LAC staining. (C) ORNs were stained (green cells, several are indicated by white arrows) in WT larval antennae. (D) ORNs were not stained in Orco KO larval antennae. (E) An ORN was stained (green cell, indicated by white arrow) in WT larval palps. (F) ORNs were not stained in KO larval palps. (G) Glomeruli in the LAC of a WT brain. (H) Glomeruli in the LAC of a KO brain. Glomeruli are indicated by white dashed circles in (G) and (H) (not directly corresponding). (I) Number of glomeruli counted in WT caterpillar brain (orange) and Orco KO caterpillar (blue) brain (n = 6 for WT and n = 5 for KO). A significant difference was detected by the Wilcoxon rank-sum test. (J) Electroantennogram (EAG) response of male butterflies (n = 18 for both WT and KO). (K) EAG response of female butterflies (n = 15 for WT and n = 17 for KO). Left panels represent WT butterfly EAG responses, and right panels represent KO butterfly EAG responses. Significant differences between WT and KO butterflies were identified using Student’s t-test when the data were normally distributed and the variances were equal or using a Kruskal–Wallis rank-sum test when these criteria did not apply. Significance levels are indicated by asterisks, ns: p > 0.05; *0.01 < p < 0.05; **0.001 < p < 0.01; ***p < 0.001; -: no response recorded from WT butterfly antennae. Butterfly antennal responses (mV) to the tested chemicals are indicated by a color scale from navy (0 mV) via yellow to red (1.2 mV).
Figure 1—figure supplement 1.
Figure 1—figure supplement 1.. Pieris brassicae caterpillar development in a Petri dish environment.
The x-axis indicates the date since caterpillars have been deposited in the Petri dish. y-axis indicates the weight of caterpillars (Ln Weight). Caterpillar weight (n = 10 for both genotypes) in this figure is presented by the median of a group of caterpillars weight in each Petri dish on day 6. Differences were tested by using a Wilcoxon rank-sum test.
Figure 1—figure supplement 2.
Figure 1—figure supplement 2.. Egg-hatching rates by wildtype (n = 11), Orco−/−_fert (n = 4), and Orco−/−_unfert (n = 10) butterflies.
Orco−/−_fert represents mated Orco female butterflies, Orco−/−_unfert represents unmated female butterflies. Differences were tested using a Kruskal-Wallis test fowolled by a Holm-corrected Wilcoxon rank-sum test.
Figure 1—figure supplement 3.
Figure 1—figure supplement 3.. Mating frequency of Pieris brassicae butterflies.
The boxplots indicate the number of spermatophores in wildtype (WT) female butterflies (n = 11) and in knockout (KO) butterflies (Orco−/−) (n = 14), and the difference was tested by using the Wilcoxon rank-sum test. WT and Orco KO butterfly spermatophores are indicated in orange and blue, respectively.
Figure 1—figure supplement 4.
Figure 1—figure supplement 4.. Pieris brassicae wildtype (WT) and Orco knockout (KO; Orco−/−) butterfly oviposition dynamics.
The orange line indicates the number of eggs per female (mean ± SE) laid by WT butterflies (n = 11), the blue line indicates the number of eggs laid by Orco KO butterflies (n = 14). Differences were analyzed using a generalized linear model (GLM) with negative binomial distribution, and difference test results are shown in the line chart.
Figure 2.
Figure 2.. Pieris brassicae caterpillar growth and foraging behavior.
(A) P. brassicae caterpillar growth on cabbage plants, y-axis shows weight (g) of wildtype (WT) and knockout (KO) caterpillars after 10 days of feeding, n = 17. (B) Caterpillar behavioral choices in a Petri dish. The numbers of caterpillars that chose one of the two discs are shown in the respective bars (n = 54–73). Schematic drawing shows behavioral setup. Petri dish diameter was 188 mm, disc diameters were 13 mm. Discs in the Petri dish represent cabbage, paper, and tomato leaf discs. Gray bars indicate paper disc choices, light green indicates cabbage leaf disc choices, and orange indicates choices for tomato leaf discs. (C) Caterpillar behavioral choices in Y-tube olfactometer without parasitoid wasps. A schematic drawing shows the Y-tube olfactometer. The dashed line indicates a black metal Y wire in the center of glass Y-tube olfactometer. The main arm of the Y-olfactometer is 200 mm length, the lateral arms are 275 mm length, and the angle between the lateral arms is 80°. Light green, dark green, and gray bars represent choices for healthy plant, infested plant, and no plant, respectively. Healthy plant, plants were not treated; no plant, an empty jar without any insect or plant; infested plant, plants were infested by early L3 caterpillars. (D) Caterpillar behavioral choices in Y-tube olfactometer with parasitoid wasps. Different treatments are in different colors. Dark green, infested plant − wasps; magenta, infested plant + wasps. Significant differences were tested between WT and KO caterpillars or between two discs by Chi-square test in panels BD, p-values are shown on the right side of each bar. (E) P. brassicae caterpillar growth when exposed to disarmed C. glomerata female parasitoids, y-axis shows weight (g) of caterpillars after 10 days of feeding, n = 8 for both genotypes. Schematic drawing shows disarmed female C. glomerata (ovipositor removed). (F) P. brassicae caterpillar survival rate when exposed to healthy C. glomerata female wasps, n = 7 for both genotypes. Significant differences in development and survival rate were assessed using a one-tailed Student’s t-test, p-values are indicated above boxplots. A schematic drawing shows a healthy female C. glomerata (unmanipulated). In both panels, orange boxplots indicate WT caterpillars, and blue boxplots indicate Orco KO caterpillars.
Figure 3.
Figure 3.. Overview of caterpillar- (Pieris brassicae) and parasitoid wasp- (Cotesia glomerata) associated volatile compounds.
(A) PCA (principal component analysis) two-dimensional score plot of five treatment groups: Cg, Cotesia glomerata female parasitoid wasps (n = 12); Pb, Pieris brassicae caterpillars (n = 10); Pb–Cg, P. brassicae caterpillars in the presence of C. glomerata female parasitoid wasps (n = 14); Pb-Fr, P. brassicae caterpillar frass (n = 10); and Pb-S, P. brassicae spit (n = 12), based on their volatile blend composition. (B) Hierarchical clustering heatmap showing the abundance of each identified volatile compound of each treatment. Clustering chemicals in the heatmap indicates higher correlation. (C) Schematic drawing of the custom-designed multichannel arena. (D) Wildtype (WT) caterpillar behavioral preference to the tested 15 odorants. (E) Orco knockout (KO) caterpillar behavioral preference to the tested 15 chemicals. Unfilled bars represent tests that exhibit no difference between paraffin oil and the odorant of interest. Blue bars indicate the cumulative duration ratio that caterpillars stayed in the paraffin oil zone, dark orange bars indicate the cumulative duration ratio that caterpillars stayed in the odorant zone. Relative time spent in odorant zone = Cumulative duration in a specific zone/Cumulative duration in the arena. Error bars indicate standard errors. In (D) and (E), differences were tested between the two zones using a Wilcoxon rank-sum test, p-values are presented above bars (n = 31–50). For each comparison, the left bar represents paraffin oil and the right bar represents chemical compound.
Figure 3—figure supplement 1.
Figure 3—figure supplement 1.. Overview of volatile blends of Pieris brassicae caterpillars, Cotesia glomerata parasitoid wasps, and caterpillars-parasitoid in interaction.
(Upper panel) OPLS-DA (Orthogonal Projection to Latent Structures Discriminant Analysis) two-dimensional score plot of treatment groups: Cg, Cotesia glomerata female parasitoid wasps (n = 12), based on their volatile content; Pb, Pieris brassicae caterpillars (n = 10); Pb–Cg, P. brassicae caterpillars in the presence of C. glomerata female parasitoid wasps (n = 14). (Lower panel) Loading plot showing the contribution of each identified volatile compound to the separation of the different treatments. Volatiles closer to the treatment in the plot indicate higher correlation. Numbers in the loading plot refer to the volatile compounds listed in Supplementary file 1A.
Figure 3—figure supplement 2.
Figure 3—figure supplement 2.. Overview of volatile blends of Pieris brassicae caterpillars and caterpillars-parasitoid (Cotesia glomerata) in interaction.
(Upper panel) OPLS-DA (Orthogonal Projection to Latent Structures Discriminant Analysis) two-dimensional score plot of treatment groups: Pb, Pieris brassicae caterpillars (n = 10); Pb–Cg, P. brassicae caterpillars in the presence of C. glomerata female parasitoid wasps (n = 14), based on their volatile content. (Lower panel) Loading plot showing the contribution of each identified volatile compound to the separation of the different treatments. Volatiles closer to the treatment in the plot indicate higher correlation. Numbers in the loading plot refer to the volatile compounds listed in Supplementary file 1A.
Figure 3—figure supplement 3.
Figure 3—figure supplement 3.. Overview of volatile blends of Pieris brassicae caterpillar spit and caterpillars-parasitoid wasp (Cotesia glomerata) in interaction.
(Upper panel) OPLS-DA (Orthogonal Projection to Latent Structures Discriminant Analysis) two-dimensional score plot of treatment groups: P. brassicae spit (n = 12), Pb–Cg, P. brassicae caterpillars in the presence of C. glomerata female parasitoid wasps (n = 14), based on their volatile content. (Lower panel) Loading plot showing the contribution of each identified volatile compound to the separation of the different treatments. Volatiles closer to the treatment in the plot indicate higher correlation. Numbers in the loading plot refer to the volatile compounds listed in Supplementary file 1A.
Figure 3—figure supplement 4.
Figure 3—figure supplement 4.. Overview of volatile blends of Pieris brassicae caterpillar spit and P. brassicae caterpillar frass.
(Upper panel) OPLS-DA (Orthogonal Projection to Latent Structures Discriminant Analysis) two-dimensional score plot of treatment groups: Pb-Fr, P. brassicae caterpillar frass (n = 10); and Pb-S, P. brassicae spit (n = 12), based on their volatile content. (Lower panel) Loading plot showing the contribution of each identified volatile compound to the separation of the different treatments. Volatiles closer to the treatment in the plot indicate higher correlation. Numbers in the loading plot refer to the volatile compounds listed in Supplementary file 1A.
Figure 3—figure supplement 5.
Figure 3—figure supplement 5.. Overview of volatile blends of Pieris brassicae caterpillars, caterpillars (P. brassicae) - parasitoids (Cotesia glomerata) in interaction, and Pieris brassicae caterpillar frass.
(Upper panel) OPLS-DA (Orthogonal Projection to Latent Structures Discriminant Analysis) two-dimensional score plot of treatment groups: Pb, Pieris brassicae caterpillars (n = 10); Pb-Fr, P. brassicae caterpillar frass (n = 10); Pb–Cg, P. brassicae caterpillars in the presence of C. glomerata female parasitoid wasps (n = 14), based on their volatile content. (Lower panel) Loading plot showing the contribution of each identified volatile compound to the separation of the different treatments. Volatiles closer to the treatment in the plot indicate higher correlation. Numbers in the loading plot refer to the volatile compounds listed in Supplementary file 1A.
Figure 3—figure supplement 6.
Figure 3—figure supplement 6.. Heatmaps of wildtype (WT) caterpillar movement in response to the tested chemicals.
The chemical compounds are indicated in the figures, and the color legend indicates the time (s) that each caterpillar stayed at certain locations.
Figure 3—figure supplement 7.
Figure 3—figure supplement 7.. Heatmaps of Orco knockout (KO) caterpillar movement in response to the tested chemicals.
The chemical compounds are indicated in the figures, and the color legend indicates the time (s) that each caterpillar stayed at certain locations.

Update of

  • doi: 10.1101/2024.12.17.629055
  • doi: 10.7554/eLife.105585.1
  • doi: 10.7554/eLife.105585.2

Similar articles

References

    1. Bernays EA. Feeding by lepidopteran larvae is dangerous. Ecological Entomology. 1997;22:121–123. doi: 10.1046/j.1365-2311.1997.00042.x. - DOI
    1. Bourne ME, Gloder G, Weldegergis BT, Slingerland M, Ceribelli A, Crauwels S, Lievens B, Jacquemyn H, Dicke M, Poelman EH. Parasitism causes changes in caterpillar odours and associated bacterial communities with consequences for host-location by a hyperparasitoid. PLOS Pathogens. 2023;19:e1011262. doi: 10.1371/journal.ppat.1011262. - DOI - PMC - PubMed
    1. Brodeur J, Geervliet JBF, Vet LEM. The role of host species, age and defensive behaviour on ovipositional decisions in a solitary specialist and gregarious generalist parasitoid (Cotesia species) Entomologia Experimentalis et Applicata. 1996;81:125–132. doi: 10.1111/j.1570-7458.1996.tb02024.x. - DOI
    1. Carpenter JE, Sparks AN. Effects of vision on mating behavior of the male corn earworm. Journal of Economic Entomology. 1982;75:248–250. doi: 10.1093/jee/75.2.248. - DOI
    1. Carrasco D, Larsson MC, Anderson P. Insect host plant selection in complex environments. Current Opinion in Insect Science. 2015;8:1–7. doi: 10.1016/j.cois.2015.01.014. - DOI - PubMed

Substances