. 2025 Aug 4:10.1158/2159-8290.CD-24-1043.
doi: 10.1158/2159-8290.CD-24-1043. Online ahead of print.

ALKBH1 drives tumorigenesis and drug resistance via tRNA decoding reprogramming and codon-biased translation

Affiliations

ALKBH1 drives tumorigenesis and drug resistance via tRNA decoding reprogramming and codon-biased translation

Chao Shen et al. Cancer Discov. .

Abstract

Cancer cells utilize codon-biased translation to fuel tumorigenesis and drug resistance, but underlying mechanisms remain poorly understood. Here, we show ALKBH1 is overexpressed in acute myeloid leukemia (AML) and essential for leukemia stem/initiating cell (LSC/LIC) self-renewal and AML development/maintenance, whereas dispensable for normal hematopoiesis. ALKBH1 enhances mitochondrial assembly/function and oxidative phosphorylation (OXPHOS), crucial for AML survival/proliferation and resistance to venetoclax, a potent BCL2 inhibitor and widely-used first-line targeted therapy for AML in clinic. Mechanistically, ALKBH1 catalyzes 5-formylcytosine (f5C) at tRNA wobble positions, reprograming decoding and facilitating codon-biased translation, a mechanism we term "Epitranslatomic Midas touch", which in turn drives leukemogenesis and drug resistance by promoting synthesis of key oncogenic proteins like WDR43. Targeting ALKBH1, particularly together with venetoclax, exhibited potent anti-leukemia efficacy in preclinical models with favorable safety profiles. Collectively, our findings elucidate ALKBH1's pivotal role in codon-biased translation and tumorigenesis, and propose a novel therapeutic strategy for cancer treatment.


Figures

Figure 1.
Figure 1.
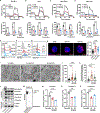
ALKBH1 is aberrantly overexpressed in AML and required for human AML progression. A, Comparison of the expression levels of ALKBH1 in primary AML patients bearing various genetic abnormalities with those in bone marrow (BM) cells from healthy donors based on the GSE13159 dataset. Data are represented as median ± quartiles. B, Western blot of ALKBH1 protein in normal controls (human BM mononuclear cells), primary AML patient BM samples, and AML cell lines. ACTIN as a loading control. C, Western blot of ALKBH1 protein in ALKBH1 knockdown (KD) MOLM13 or NB4 cells. VINCULIN as a loading control. D-I, Effects of ALKBH1 KD on AML cell viability (D, MOLM13; E, NB4; H, MA9.3RAS; I, AML-0148) and apoptosis (F, MOLM13; G, NB4), n = 3. J and K, Effects of ALKBH1 KD on the colony forming ability of MA9.3RAS (J) and AML-0148 cells (K), n = 2. L-O, NRGS mice were transplanted with MOLM13 cells expressing control (shNS) or ALKBH1 shRNA (shA1-#1). At day 25 post-transplantation, White blood cell counts (WBC) (L), human AML engraftment in peripheral blood (PB) (M) and BM (N) were compared. O: Kaplan-Meier survival curves of NRGS mice in the shNS (n = 11) and shA1-#1 (n = 8) groups. P-S, NRGS mice transplanted with luciferase-expressing MA9.3RAS or AML-0148 cells inducibly expressing shNS (Tet-shNS) or ALKBH1 shRNAs (Tet-shA1-#1/-#2) via doxycycline diet. Leukemia burden assessed by weekly imaging (P and Q). Survival analyzed by Kaplan-Meier curves (R, MA9.3RAS: Tet-shNS, n = 9; Tet-shA1-#1, n = 9; Tet-shA1-#2, n = 6; S, AML-0148: Tet-shNS, n = 7; Tet-shA1-#1, n = 8; Tet-shA1-#2, n = 8). Data shown as mean ± SEM (D-N). Statistical analyses: unpaired two-sided t-test (A and L-N), one-way ANOVA (F and G), two-way ANOVA (D, E, H and I), and log-rank test (O, R and S). *p < 0.05; **p < 0.01; ***p < 0.001; ****p < 0.0001.
Figure 2.
Figure 2.
ALKBH1 is required for AML development/maintenance and self-renewal of leukemia stem/initiating cells (LSCs/LICs). A, Outline of the BMT assays studying leukemogenesis, leukemia maintenance and LSC self-renewal in vivo. B, Kaplan-Meier survival curves for primary BMT recipient mice (WT, n = 8; KO, n = 7). C-E, AML development analysis at day 86 post-primary BMT: Leukemia burden (percentage of CD45.2+ cells) in the PB, BM and spleen (C), spleen weight (D), and liver weight (E) (WT, n = 3; KO, n = 4). F-H, CD45.2+ BM cells were isolated from primary BMT mice and transplanted into recipient mice for secondary BMT assay. Kaplan-Meier survival curves (F, n = 8 per group), WBC counts (G) and leukemia burden (H) in PB on day 21 post-BMT (WT, n = 7; KO, n = 8). I, Comparison of ALKBH1 expression levels between AML LSC (CD34+) cells and AML bulk (CD34) cells from AML patients (n = 12), and between CD34+ and CD34 cells from healthy controls (n = 7) using single-cell RNA sequencing data (GSE74246). J-R, Two-stage xenograft model assessing LSC/LIC dependency on ALKBH1. (J) Schematic picture illustrating the two-stage xenograft model with inducible ALKBH1 KD. (K-N) Stage I analysis: human leukemia burden in mouse PB (K) and BM (L), LSC/LIC frequency (M) and apoptosis (N) of human leukemia engrafts in mouse BM. (O-R) Stage II (doxycycline withdrawal) analysis: human leukemia burden in mouse PB (O) and BM (P), LSC/LIC frequency (Q) and apoptosis (R) of human leukemia engrafts in mouse BM. S, In vivo limiting dilution assay (LDA, n = 4–5 mice per group). Data are represented as mean ± SEM (C-E, G-I and K-R). Statistical analyses: unpaired two-sided t-test (C-E, G-I, K-R) and log-rank test (B, F, S). *p < 0.05; **p < 0.01; ***p < 0.001; ****p < 0.0001; ns, not significant.
Figure 3.
Figure 3.
ALKBH1 is dispensable for normal hematopoiesis. A, Complete Blood Count (CBC) analysis of PB from 6- to 10-weeks Alkbh1 WT (n = 13) and homozygous KO (n = 10) mice. B-D, Effects of Alkbh1 deletion on mature hematopoietic cells. Percentage of mature myeloid cells in BM (B), B cells in spleen (C) and T cells in thymus (D) from Alkbh1 WT (n = 5) or homozygous KO (n = 4) littermates. E and F, Percentage of hematopoietic stem/progenitor cell (HSPC) subpopulations in Alkbh1 WT (n = 7) and homozygous KO (n = 5) littermates. G, Experimental strategy for in vivo competitive transplantation assays. H, Percentage of CD45.2+ cells in PB of BMT recipient mice (n = 9 per group) at indicated time points. I, CD45.2+ percentages within mature hematopoietic cells in PB (n = 9 per group). J, CD45.2+ percentages within BM HSPCs in recipient mice from Alkbh1 WT (n = 7–9) or homozygous KO (n = 8) groups. K-O, Effects of ALKBH1 depletion on normal human hematopoiesis. Percentage of GFP+ cells in human engrafts in BM (K), and percentages of myeloid cells (L), B cells (M), T cells (N) and HSPCs (O) within GFP+ human engrafts in BM. Data represented as mean ± SEM (A-F and H-O). Statistical tests: unpaired two-sided t-test (A-D), one-way (K-N) or two-way (E, F, H-J and O) ANOVA. *p < 0.05; **p < 0.01; ns, not significant.
Figure 4.
Figure 4.
ALKBH1 regulates mitochondrial functions/structure in AML cells. A-D, Effects of ALKBH1 KD on oxygen consumption rate (OCR) and mitochondrial respiration in AML cell lines (A, MOLM13; B, NB4), LSC cells (C, MA9.3RAS) and primary AML patient cells (D, AML-0148), n = 5–7 technical replicates, representative of n = 3. E-G, Flow cytometry analysis of mitochondrial functions in control (shNS) or ALKBH1 KD MOLM13. (E) percentage of live cells (DAPI) with low mitochondrial membrane potential (MMP), (F) mitochondrial ROS levels measured by MitoSox mean fluorescence intensity (MFI) in non-apoptotic cells (Annexin V), and (G) percentage of non-apoptotic cells (Annexin V) with high cellular ROS levels, representative of n = 2. H, Confocal microscopy images and mitochondrial mass quantification (Mitochondrial/nuclear area ratio) in MOLM13 cells (shNS, n = 66 cells; shA1-#1, n = 20 cells; shA1-#2, n = 29 cells). Bar = 10 μm. I-K, Transmission electron microscopy (TEM) of mitochondrial structures in MOLM13 cells with inducible ALKBH1 KD. (I) Representative images (orange arrows, normal cristae; red arrows, abnormal cristae). Bar = 500 nm. (J) Statistic analysis of maximum cristae width (Tet-shNS, n = 138; Tet-shA1-#1, n = 123; Tet-shA1-#2, n = 191 cristae). (K) Percentage of mitochondria with abnormal cristae (Tet-shNS, n = 30; Tet-shA1-#1/-#2, n = 38 mitochondria each). L and M, BN-PAGE analysis of mitochondrial OXPHOS complex assembly in MOLM13 cells: individual complexes I-V (L), and supercomlex (M), representative of n = 2. N-P, Enzymatic activity of mitochondrial complexes immunocaptured from control (Tet-shNS) or induced ALKBH1 KD MOLM13 cells: complex I (N), complex IV (O) and complex V (P). n = 4 (2 technical replicates x 2 biological replicates) in N and P, n = 3 in O. Data presented as mean ± SEM (A-D, H, J, K and N-P). Statistical analyses: one-way ANOVA (H, J, K and N-P), and two-way ANOVA (A-D). *p < 0.05; **p < 0.01; ***p < 0.001; ****p < 0.0001.
Figure 5.
Figure 5.
ALKBH1 promotes f5C formation in tRNAs and is essential for protein translation in AML. A, Western blotting (left) and growth competition assay (right) showing rescue effects of ALKBH1 WT or Mut overexpression in ALKBH1 KO MM6 cells (n = 2). B, Strategy to identify authentic ALKBH1 substrates in AML cells. C and D, Relative m5Cm and f5C levels in total tRNAs quantified by QQQ-MS from ALKBH1 KD MOLM13 (C) and AML-0148 (D) cells (n = 4). E, Relative m5Cm and f5C levels in total tRNAs from control (EV) or ALKBH1 WT or Mut overexpressed MOLM13 cells (n = 3–4). F, In vitro demethylation/oxidization assay measuring m5Cm and f5C levels in total tRNAs from MOLM13 cells via QQQ-MS (n = 3). G and H, Effects of ALKBH1 KD on global protein translation in MOLM13 (n = 4) and AML-0148 (n = 3) cells, shown as percentage of HPG+ cells (G) and Western blotting of puromycin-labeled nascent proteins (H, representative of n = 2). I, Cumulative frequency analysis of global translation efficiency (TE). J, Ribosome profiling sequencing (Ribo-seq) analysis of global TE changes. Red dots, p < 0.05; grey dots, p > 0.05; grey dash lines indicate foldchange (FC) = 2. K, Gene ontology (GO) analysis of genes with significantly down-regulated TE (TE Down) upon ALKBH1 KD. L, Mitochondrial pathway analysis of Mito genes with significantly down-regulated TE (TE Down mito-genes) upon ALKBH1 KD. M, Quantitative proteomics. Red dots, p < 0.001; blue dots, 0.001 ≤ p < 0.01; yellow dots, 0.01 ≤ p < 0.05; grey dots, p ≥ 0.05, grey dash lines indicate FC = 1.5. N, GO analysis of significantly down-regulated proteins (Pro Down) upon ALKBH1 KD. O, Mitochondrial pathway analysis of Mito genes with significantly down-regulated protein levels (Pro Down mito-genes) upon ALKBH1 KD. P, Venn diagram analysis of TE Down genes and Pro Down genes, with GO analysis of overlapping genes. Data presented as mean ± SEM (A and C-G). Statistical analyses: one-way ANOVA (C-G), and log-rank test (I). *p < 0.05; **p < 0.01; ***p < 0.001; ****p < 0.0001.
Figure 6.
Figure 6.
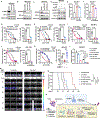
WDR43 is a direct translational target of ALKBH1 and mediates ALKBH1 function in AML. A, ALKBH1 tRNA targets with potential wobble position f5C modifications (from GSE202815), showing original codons (Ori codons, blue) and f5C-expanded codons (f5C codons, red). B, Codon usage analysis of ALKBH1 translational targets (TE Down & Pro Down, 509 genes). Blue dots: original codons; red dots: f5C-expanded codons. C, Northern blot of tRNA-Leu-CAA from input and Flag-RNA immunoprecipitation (RIP) in MOLM13 cells overexpressing ALKBH1 WT (A1-WT) or empty vector (EV). D, f5C levels at the wobble position (C34) in tRNA-Leu-CAA as quantified by Pyridine borane f5C-seq. C-to-T mutation ratio (%) indicates f5C modification level. n = 2–3. E, Venn diagram identifying direct ALKBH1 translational targets in the ribonuclear protein complex (Ribo) pathway. F, Polysome profiling of WDR43 mRNA translation. qPCR detection in individual fractions (left, n = 3 technical replicates, representative of n = 3) and pooled fractions (right, n = 3). G, Translation efficiency changes of endogenous versus codon-swapped WDR43 transcripts upon ALKBH1 depletion, n = 4 (2 biological replicates x 2 technical replicates). H and I, Western blotting of ALKBH1 and WDR43 in control and ALKBH1 KD MOLM13 (H) and AML-0148 (I) cells. J and K, Effects of WDR43 KD on cell survival/viability of MOLM13 (J) and NB4 (K) cells (n = 3). L-P, Impact of WDR43 KD in MOLM13 cells on apoptosis (L, n = 4), OCR and respiration (M, n = 5–7 technical replicates, representative of n = 2), percentage of live cells (DAPI) with low MMP (N, n = 4), global protein translation as measured by HPG labeling (O, n = 3) and mitochondrial translation (P, n = 4). Q-W, WDR43 restoration rescued ALKBH1 depletion-induced phenotypes in MOLM13 cells. Western blot of ALKBH1 and WDR43 (Q), cell growth/viability (R, n = 3), apoptosis (S, n = 3), OCR and respiration (T and U, n = 5–7 technical replicates, representative of n = 2), percentage of live cells (DAPI) with low MMP (V, n = 3), global protein translation by HPG labeling (W, n = 3). Data presented as mean ± SEM (D, F, G, J-P and R-W). Statistical analyses: unpaired two-sided t-test (D), one-way ANOVA (L, N-P, S, V and W), and two-way ANOVA (F, G, J, K, M, R and U). *p < 0.05; **p < 0.01; ***p < 0.001; ****p < 0.0001.
Figure 7.
Figure 7.
Targeting the ALKBH1/WDR43/BCL2 axis greatly enhances venetoclax-based therapy efficacy in AML. A and B, Western blotting of ALKBH1 and BCL-2 in control (shNS) and ALKBH1 KD MOLM13 (A) and AML-0148 (B) cells. C, Western blotting of WDR43 and BCL-2 in control (shNS) and WDR43 KD MOLM13 cells. D, Western blotting for ALKBH1, WDR43 and BCL-2 in control (Tet-shNS + EV), ALKBH1 KD (Tet-shA1 + EV), and WDR43 overexpression rescue (Tet-shA1 + WDR43) MOLM13 cells. E and F, Effects of ALKBH1 KD (E) or WDR43 KD (F) on BCL2-specific mitochondrial priming in MOLM13 cells, n = 3. G and H, Dose–response curves and IC50 of venetoclax in control (Tet-shNS) or induced ALKBH1 KD MOLM13 (G) and AML-0148 (H) cells, n = 3. I and J, Dose–response curves and IC50 of venetoclax in control (Tet-shNS) or induced WDR43 KD MOLM13 (I) and AML-0148 (J) cells, n = 3. K, Dose–response curves and IC50 of venetoclax in control (Tet-shNS + EV), ALKBH1 KD (Tet-shA1 + EV) or WDR43 overexpression rescued (Tet-shA1 + WDR43) MOLM13 cells, n = 3. L, Relative cell viability by MTT assay in MOLM13 cells treated with ALKBH1 KD (A1 KD), venetocalx (Ven, 100 nM) and/or azacitidine (AZA, 3 μM) (n = 3). M, Whole-body animal imaging showing leukemia burden in recipient mice (n = 5 mice per group). N, Kaplan-Meier survival curves of AML-bearing mice treated with vehicle, venetoclax (Ven), or venetoclax plus azacitidine (Ven + AZA), with or without ALKBH1 KD. Group sizes: Con + Vehicle (n = 8), Con + Ven (n = 7), Con + Ven + AZA (n = 7), A1 KD + Vehicle (n = 7), A1 KD + Ven (n = 6), A1 KD + Ven + AZA (n = 7). O, Schematic illustrating the mechanisms underlying therapeutic targeting of ALKBH1 in AML. Data presented as mean ± SEM (E-L). Statistical analyses: one-way ANOVA (E-L) and log-rank test (N). *p < 0.05; **p < 0.01; ***p < 0.001; ****p < 0.0001.

References

    1. Song P, Yang F, Jin H, Wang X. The regulation of protein translation and its implications for cancer. Signal Transduct Target Ther 2021;6(1):68 doi 10.1038/s41392-020-00444-9. - DOI - PMC - PubMed
    1. Chan C, Pham P, Dedon PC, Begley TJ. Lifestyle modifications: coordinating the tRNA epitranscriptome with codon bias to adapt translation during stress responses. Genome biology 2018;19(1):228 doi 10.1186/s13059-018-1611-1. - DOI - PMC - PubMed
    1. Hia F, Takeuchi O. The effects of codon bias and optimality on mRNA and protein regulation. Cell Mol Life Sci 2021;78(5):1909–28 doi 10.1007/s00018-020-03685-7. - DOI - PMC - PubMed
    1. Mitchener MM, Begley TJ, Dedon PC. Molecular Coping Mechanisms: Reprogramming tRNAs To Regulate Codon-Biased Translation of Stress Response Proteins. Acc Chem Res 2023;56(23):3504–14 doi 10.1021/acs.accounts.3c00572. - DOI - PMC - PubMed
    1. Li P, Wang W, Zhou R, Ding Y, Li X. The m(5) C methyltransferase NSUN2 promotes codon-dependent oncogenic translation by stabilising tRNA in anaplastic thyroid cancer. Clin Transl Med 2023;13(11):e1466 doi 10.1002/ctm2.1466. - DOI - PMC - PubMed