

Electroconductivity of Saliva as a Diagnostic Tool for Dry Eye Disease: A Case-Control Study
- PMID: 40747991
- PMCID: PMC12320899
- DOI: 10.1167/tvst.14.8.2
Electroconductivity of Saliva as a Diagnostic Tool for Dry Eye Disease: A Case-Control Study
Abstract
Purpose: To evaluate the diagnostic potential of body fluid electroconductivity for dry eye disease (DED) and compare its accuracy with commonly used DED tests.
Methods: Individuals with dry eye (n = 36) and controls (n = 26) were enrolled in this case-control prospective study. Electroconductivity measurements were performed on blood, serum, tears, urine, and saliva. Dry eye assessments included tear film breakup time (TBUT) and Schirmer test (Schirmer), with symptoms evaluated using the Ocular Surface Disease Index (OSDI). Blood and urine analyses were performed to assess the baseline systemic profiles of both groups.
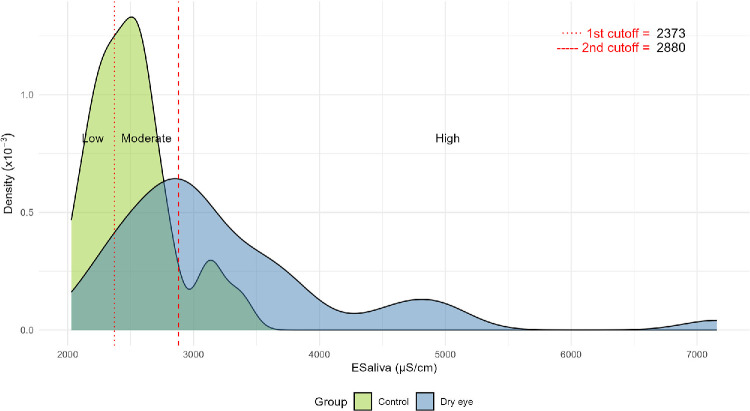
Results: Among all body fluids, saliva (saliva electroconductivity [ESaliva]) showed the most significant differences in electroconductivity between controls and dry eye individuals (2514.02 ± 329.18 vs. 3262.00 ± 992.47 µS/cm, P < 0.001). ESaliva showed robust diagnostic performance (area under the curve [AUC] = 0.800), comparable to TBUT (AUC = 0.693, P = 0.103) and superior to Schirmer (AUC = 0.536, P < 0.001). OSDI showed a moderate correlation with ESaliva (r = 0.43, P < 0.001), representing the strongest association, followed by TBUT (r = -0.26, P = 0.004) and Schirmer (r = -0.09, P = 0.313). Cross-validation procedure identified ESaliva cutoffs of 2373 µS/cm (95% confidence interval [CI], 2340-2456) for low-to-moderate and 2880 µS/cm (95% CI, 2845-2931) for moderate-to-high DED risk. Net reclassification improvement and integrated discrimination improvement analyses confirmed ESaliva's superior predictive ability. A single cutoff of 2880 µS/cm yielded 64% sensitivity and 89% specificity for DED prediction.
Conclusions: ESaliva effectively distinguishes patients with DED and exhibits superior diagnostic performance.
Translational relevance: ESaliva: offers a noninvasive and self-assessable tool for DED diagnosis.
Conflict of interest statement
Disclosure:
Figures


References
-
- Papas EB. The global prevalence of dry eye disease: a Bayesian view. Ophthalmic Physiol Opt. 2021; 41: 1254–1266. - PubMed
-
- Wolffsohn JS, Arita R, Chalmers R, et al.. TFOS DEWS II diagnostic methodology report. Ocul Surf. 2017; 15: 539–574. - PubMed
-
- Moskalenko YE, Naumenko A. Movement of the blood and changes in its electrical conductivity. Bull Exp Biol Med. 1959; 47: 211–215.
-
- Trautman ED, Newbower RS. A practical analysis of the electrical conductivity of blood. IEEE Trans Biomed Eng. 1983; 30: 141–154. - PubMed
MeSH terms
LinkOut - more resources
Full Text Sources
