Natural History Collections at the Crossroads: Shifting Priorities and Data-Driven Opportunities
- PMID: 40747995
- PMCID: PMC12315612
- DOI: 10.1111/ele.70188
Natural History Collections at the Crossroads: Shifting Priorities and Data-Driven Opportunities
Abstract
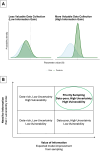
Natural history collections face a critical juncture as environmental change and biodiversity crises accelerate. While collections data are key components of eco-evolutionary and environmental research in both fundamental and applied contexts, collecting strategies remain primarily taxonomically motivated. We argue that sampling strategies must evolve to better address broader ecological challenges, through emerging applications enabled by advances in data science and digital technology. Here, we propose a flexible framework using modern statistical approaches to optimise sampling design and research prioritisation. By considering biodiversity, environmental, spatial and temporal dimensions, we demonstrate how information theory and decision science tools can support strategic collecting, databasing and digitisation efforts. Our framework provides an evidence-based pathway for collections to enhance their role as critical research infrastructure for addressing 21st century environmental challenges. To illustrate this data-driven approach to research prioritisation, we present an example based on sampling design for wombats (Vombatus ursinus) in Australia.
Keywords: Bayesian decision theory; FAIR data principles; adaptive sampling design; conservation planning; data science; digital extended specimen; museum genomics; natural history collections; research prioritisation; value of information.
© 2025 The Author(s). Ecology Letters published by John Wiley & Sons Ltd.
Figures


Similar articles
-
How to Implement Digital Clinical Consultations in UK Maternity Care: the ARM@DA Realist Review.Health Soc Care Deliv Res. 2025 May;13(22):1-77. doi: 10.3310/WQFV7425. Health Soc Care Deliv Res. 2025. PMID: 40417997 Review.
-
Fabricating mice and dementia: opening up relations in multi-species research.In: Jenkins N, Jack-Waugh A, Ritchie L, editors. Multi-Species Dementia Studies. Bristol (UK): Bristol University Press; 2025 Feb 25. Chapter 2. In: Jenkins N, Jack-Waugh A, Ritchie L, editors. Multi-Species Dementia Studies. Bristol (UK): Bristol University Press; 2025 Feb 25. Chapter 2. PMID: 40690569 Free Books & Documents. Review.
-
Participation in environmental enhancement and conservation activities for health and well-being in adults: a review of quantitative and qualitative evidence.Cochrane Database Syst Rev. 2016 May 21;2016(5):CD010351. doi: 10.1002/14651858.CD010351.pub2. Cochrane Database Syst Rev. 2016. PMID: 27207731 Free PMC article.
-
Stakeholders' perceptions and experiences of factors influencing the commissioning, delivery, and uptake of general health checks: a qualitative evidence synthesis.Cochrane Database Syst Rev. 2025 Mar 20;3(3):CD014796. doi: 10.1002/14651858.CD014796.pub2. Cochrane Database Syst Rev. 2025. PMID: 40110911
-
Looking back to look ahead: the temporal dimension of conservation seed bank collections.New Phytol. 2025 Aug;247(4):1589-1598. doi: 10.1111/nph.70187. Epub 2025 May 6. New Phytol. 2025. PMID: 40329627 Free PMC article. Review.
References
-
- Akinlotan, M. D. , Warne D. J., Helmstedt K. J., et al. 2024. “Beyond Expected Values: Making Environmental Decisions Using Value of Information Analysis When Measurement Outcome Matters.” Ecological Indicators 160: 111828.
-
- Anderson, R. P. , Araújo M. B., Guisan A., et al. 2020. “Optimizing Biodiversity Informatics to Improve Information Flow, Data Quality, and Utility for Science and Society.” Frontiers of Biogeography 12, no. 3: e47839.
-
- Australian Bureau of Statistics . 2021. “Australian Statistical Geography Standard (ASGS) Edition 3”.
MeSH terms
LinkOut - more resources
Full Text Sources

