. 2025 Aug 1:14:RP106657.
doi: 10.7554/eLife.106657.

Conserved and unique features of terminal telomeric sequences in ALT-positive cancer cells

Affiliations

Conserved and unique features of terminal telomeric sequences in ALT-positive cancer cells

Benura Azeroglu et al. Elife. .

Abstract

A significant portion of human cancers utilize a recombination-based pathway, alternative lengthening of telomeres (ALT), to maintain telomere length. Targeting the ALT is of growing interest as a cancer therapy, yet a substantial knowledge gap remains regarding the basic features of telomeres in ALT-positive cells. To address this, we adopted END-seq, an unbiased sequencing-based approach, to define the identity and regulation of the terminal sequences of chromosomes in ALT cells. Our data reveal that the terminal portions of chromosomes in ALT cells contain canonical telomeric sequences with the same terminus bias (-ATC) observed in non-ALT cells. Furthermore, as reported for non-ALT cells, POT1 is required to preserve the precise regulation of the 5' end in cells that maintain telomere length using the ALT pathway. Thus, the regulation of the terminal 5' of chromosomes occurs independently of the mechanism of telomere elongation. Additionally, we employed an S1 endonuclease-based sequencing method to determine the presence and origin of single-stranded regions within ALT telomeres. These data shed light on conserved and unique features of ALT telomeres.

Keywords: ALT; END-seq; cancer biology; chromosomes; gene expression; human; mouse; ssDNA; telomeres.


Conflict of interest statement

BA, WW, RP, RS, TM, AN, EL No competing interests declared

Figures

Figure 1.
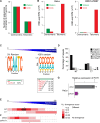
Figure 1.. END-seq successfully captures the 5′ termini of human and mouse chromosomes.
(A) Schematic representation of the END-seq method applied to double-strand breaks (DSBs) (left) and natural chromosome ends (right). Blunted dsDNA ends are ligated to biotinylated adaptors, purified, and subsequently sequenced by next-generation sequencing (NGS). Reads originating from DSBs align to either side of the break (left), while telomeric reads align only to the 5′ C-rich template (red). (B) Number of reads containing at least four consecutive telomeric repeats corresponding to the G-rich (green) and C-rich (red) strands in HeLa and RPE1 cell lines. Telomeric reads are normalized to the total number of reads identified by END-seq and are represented as reads per million (RPM). (C) Sequence logo representing the conservation (bits) of the last 6 nucleotides at the 5′ end of chromosomes in HeLa and RPE1 cells. (D) Distribution of the three most frequent telomeric repeats across human cell lines (orange), mouse cells (yellow), and a canine cell line (purple). (E) Schematic representation of T7-mediated randomization of the 5′ termini. (F) Percentage of telomeric reads that have the indicated sequence as a 5′ end. The following sequences (CCCAAT-5′, TCCCAA-5′, and ATCCCA-5′) are grouped and labeled as ‘Rest’. Kullback–Leibler divergence (KL divergence) analysis was used to compare the distributions of the individual conditions. KL divergence between 0.25 and 0.375 is represented by two dots. Prior to the END-seq protocol, cells were either left untreated (NT) or were treated with T7. (G) Percentage of telomeric reads is displayed as described in (F). Cells expressing either a nontargeting shRNA (shScr) or an shRNA targeting POT1 (shPOT1) were harvested 3 days post induction and analyzed by END-seq. KL divergence between 0.125 and 0.25 is represented by one dot (●).
Figure 1—figure supplement 1.
Figure 1—figure supplement 1.. Analysis of telomeric and centromeric reads and 5′ termini randomization.
(A) Relative abundance of pan-centromeric and telomeric reads. Reads per million (RPM) of pan-centromeric and telomeric reads found in the human T2T reference genome (Nurk et al., 2022). (B) Normalized number of pan-centromeric and telomeric reads aligned to Watson and Crick strands in HeLa and RPE1-hTERT cell lines. For telomeres, three units of TTAGGG or CCCTAA were used to call Watson (green) or Crick (red) strands. For centromeres, one unit of AAACTAGACAGAAGCATT or AATGCTTCTGTCTAGTTT was used to call Watson (green) or Crick (red) strands. (C) Sequence logo representing the conservation (bits) of the 5′ termini with absolute randomization (top) versus absolute precision (bottom). (D) Effect of in vitro randomization of 5′ termini by T7 exonuclease. Replotting of data presented in Figure 1F. Percentage of telomeric reads that have the indicated sequence as a 5′ sequence that have as a 5′ end. (E, F) Comparison of experimental data with modeled predictions to assess the impact of varying degrees of randomization on the CCAATC-5′ termini. The data presented in Figure 1F for in-plug treatment of T7 (E) and in Figure 1G for POT1 depletion (F) show varying degrees of randomization compared to their respective untreated controls. (G) Relative expression level of POT1 in HeLa cells expression inducible shRNA against POT1 (shPOT1) compared to control (shScr) after 3 days of shRNA induction by doxycycline.
Figure 2.
Figure 2.. POT1a is the key regulator of 5′ telomere end processing in mice, distinct from POT1b.
(A) Comparison of the effect of single and double depletion of POT1a and POT1b on the percentage of telomeric reads with the indicated 5′ end sequences. The following sequences (CCCAAT-5′, TCCCAA-5′, and ATCCCA-5′) are grouped and labeled as ‘Rest’. Kullback–Leibler divergence (KL divergence) analysis was used to compare the distributions across conditions. KL divergence between 0.25 and 0.375 is represented by two dots. (B) Sequence logo illustrating the conservation (in bits) of the last 6 nucleotides at the 5′ end of chromosomes in POT1-proficient, POT1a-depleted, POT1b-depleted, and POT1a/POT1b double-depleted mouse embryonic stem cells (mESCs).
Figure 2—figure supplement 1.
Figure 2—figure supplement 1.. CRISPR/Cas9-mediated endogenous knock-in and knockout of POT1a and POT1b in mouse embryonic stem cells (mESCs) with functional validation.
(A) Schematic of the POT1a genomic locus (red) and repair template containing homology arms to the Pot1a locus (red), selection marker blasticidin (BSD), 3xflag tag, and FKBP12F36V (blue). Scissors represent the CRISPR/Cas9 cut site used for endogenous knock-in generation. Sanger sequencing confirms the newly generated FKBP12F36V and POT1a junction. (B) PCR genotyping to detect knock-in was performed. (C) Western blot analysis of mESCs expressing Flagx3-FKBP12F36V::POT1a treated with or without dTAG13 (500 nM) for 24 hr. (D) Schematic of the POT1b genomic locus showing exons targeted by sgRNAs (exon 2, E2, in red and exon 4, E4, in blue) and untargeted exons (gray), with wild-type and knockout conditions indicated. Scissors mark the CRISPR/Cas9 cut site used to generate the knockout cell line. Primers for genotyping are labeled as P1, P2, and P3 with arrows. Sanger sequencing confirms the knock-out by generation of newly generated exon 2 and exon 4 junction, resulting in a deletion and frameshift. (E) PCR genotyping to detect knockdown was performed. (F) Relative expression level of POT1b in mESCs compared to control. (G) Comparison of experimental data presented in Figure 2A with modeled predictions to assess the impact of varying degrees of randomization on the CCAATC-5′ termini.
Figure 3.
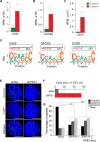
Figure 3.. Alternative lengthening of telomeres (ALT) cells have precise 5′ termini.
(AC) Number of telomeric reads containing at least four consecutive telomeric repeats corresponding to the G-rich (green) and C-rich (red) strands in the ALT-positive G292, SAOS2, and U2OS cell lines. Telomeric reads are normalized to the total number of reads identified by END-seq and are represented as reads per million (RPM). (D) Sequence logo representing the conservation at chromosome ends. A sequence logo representing the conservation (bits) of the last 6 nucleotides at the 5′ end of chromosomes in ALT cells. Fraction of reads with CCAATC as 5′ end is displayed. (E) Cells expressing either a nontargeting shRNA (shScr) or a shRNA targeting POT1 (shPOT1-1) were stained for 53BP1 (red) and telomeric DNA (TTAGGG, green). The scale bar represents 10 μm. (F) Quantification of the data shown in (E). Graphs indicated the percentage of cells that have at least five telomere dysfunctional foci (TIF) with 53BP1 co-localizing at telomeres. (G) Percentage of telomeric reads that have the indicated sequence as a 5′ sequence that have as a 5′ end. The following sequences (CCCAAT-5′, TCCCAA-5′, and ATCCCA-5′) are grouped and labeled as ‘Rest’. Cells expressing either a nontargeting shRNA (shScr) or a shRNA targeting POT1 (shPOT1-1 and shPOT1-2) were harvested 3 days post induction and analyzed by END-seq. Kullback–Leibler divergence (KL divergence) analysis was used to compare the distributions of the individual conditions. KL divergence between 0.25 and 0.375 is represented by two dots (●●), KL divergence greater than 0.375 is represented by three dots (●●●).
Figure 3—figure supplement 1.
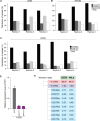
Figure 3—figure supplement 1.. Analysis of 5′ termini and of presence of variant telomeric repeats in U2OS.
(AC) Distribution of telomeric reads across biological replicates of ALT-positive G292 (A), SAOS2 (B), and U2OS Cells. The following sequences (CCCAAT-5′, TCCCAA-5′, and ATCCCA-5′) are grouped and labeled as ‘Rest’. (D) Relative expression level of POT1 in U2OS cells expression of two different inducible shRNA against POT1 (shPOT1-1 and shPOT1-2) compared to control (shScr) after 3 days of shRNA induction by doxycycline. (E) Percentage of canonical telomeric reads (CTRs) and variant telomeric reads (VTRs) within the first 30 nucleotides from the 5′ of the terminal of Illumina reads from U2OS or HeLa cells.
Figure 4.
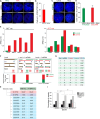
Figure 4.. Alternative lengthening of telomeres (ALT) telomeres are readily distinguished due to presence of telomeric ssDNA by sequencing.
(A) Schematic representation of the S1-END-seq method applied to telomeres containing either an internal ssDNA region (left) or only the natural G-rich overhang (right). S1 nuclease treatment cleaves ssDNA regions generating two-ended double-strand break (DSB) (left) or one-ended DSB (right). DNA ends are ligated to biotinylated adaptors, purified, and subsequently sequenced by NGS. Reads originating from the double-ended DSB align to either side of the break (left), resulting in C-rich (red) and G-rich (green) reads. Reads originating from the single-ended chromosome ends align only to the C-rich template (red). (B) Proportion of telomeric reads (containing at least four consecutive telomeric reads) corresponding to G-rich reads (green) or C-rich reads (red). (C, D) Proportion of telomeric reads (containing at least four consecutive telomeric reads) corresponding to G-rich reads (green) or C-rich reads (red) in BLM-proficient (U2OS) or -deficient (BML-/-) cells by END-seq (C) or S1-seq (D). (E) Native telomeric FISH (ssTelo) in BLM-proficient (U2OS) or -deficient (BML-/-) cells either left untreated (control) or expressing TRF1-Fok1. The scale bar represents 10 μm. (F) Quantification of the data shown in (E), cells with five ssTelo signal (or greater) were scored as positive. When indicated, cells were induced to express the TRF1-Fok1 nuclease for 24 hr prior to harvesting. (G, H) Proportion of telomeric reads (containing at least four consecutive telomeric reads) corresponding to G-rich reads (green) or C-rich reads (red) in BLM-proficient (U2OS) or -deficient (BML-/-) cells expressing TRF1-Fok1 by END-seq (G) or S1-seq (H).
Figure 4—figure supplement 1.
Figure 4—figure supplement 1.. ssDNA in alternative lengthening of telomeres (ALT) telomeres.
(A, B) Representative images and quantification of the percentage of ALT-positive U2OS cells and ALT-negative HeLa cells with more than 5 RPA foci colocalizing to TRF2. Data shown repeated in triplicate with a minimum of 250 cells counted per cell line. Error bars represent the standard error of the mean where n=3. The scale bar represents 10 μm. (C, D) Representative images and quantification of the percentage of ALT-positive U2OS cells and ALT-negative HeLa cells with more than five FISH foci where the staining is done under native conditions (ssTelo) to label single-stranded G-rich telomeric DNA (ssTeloG, green) or C-rich telomeric DNA (ssTeloC, red). Data shown repeated in triplicate with a minimum of 250 cells counted per cell line. Error bars represent the standard error of the mean where n=3. The scale bar represents 10 μm. (E) Number of reads containing at least four consecutive telomeric repeats corresponding to the G-rich (green) and C-rich (red) strands in a panel of ALT-negative and ALT-positive cells. Telomeric reads are normalized to the total number of reads identified by S1-END-seq and are represented as reads per million (RPM). (F) Schematics representing the expected number of C-strand and G-strand reads obtained by S1-END-seq in the absence of ssDNA regions within telomeres (1 end), or in the presence of 1 or 2 ssDNA. Bottom graph represents the expected ratio of C/G reads normalized to the total number of telomeric reads. (G) Table representing the expected number of C-strand and G-strand reads following a S1-END-seq in the presence of the listed number of ssDNA region with a single chromosome end. (H) Percentage of canonical telomeric reads (CTRs) and variant telomeric reads (VTRs) within the first 30 nucleotides from the 5′ of the terminal of Illumina reads from END-seq and S1-END-seq libraries of U2OS Cells. (I) Percentage of telomeric reads that have the indicated sequence as a 5′ sequence that have as a 5′ end. The following sequences (CCCAAT-5′, TCCCAA-5′, and ATCCCA-5′) are grouped and labeled as ‘Rest’. Cells expressing either a nontargeting shRNA (shScr) or a shRNA targeting POT1 (shPOT1-1 and shPOT1-2) were harvested 3 days post induction and analyzed by S1-END-seq. Kullback–Leibler divergence (KL divergence) analysis was used to compare the distributions of the individual conditions. KL divergence less than 0.125 are considered nonsignificant and indicated as n/s.

Update of

References

    1. Arora R, Lee Y, Wischnewski H, Brun CM, Schwarz T, Azzalin CM. RNaseH1 regulates TERRA-telomeric DNA hybrids and telomere maintenance in ALT tumour cells. Nature Communications. 2014;5:5220. doi: 10.1038/ncomms6220. - DOI - PMC - PubMed
    1. Azeroglu B, Ozbun L, Pegoraro G, Lazzerini Denchi E. Native FISH: A low- and high-throughput assay to analyze the alternative lengthening of telomere (ALT) pathway. Methods in Cell Biology. 2024;182:265–284. doi: 10.1016/bs.mcb.2022.10.010. - DOI - PubMed
    1. Azeroglu B, Khurana S, Wang SC, Tricola GM, Sharma S, Jubelin C, Cortolezzis Y, Pegoraro G, Miller KM, Stracker TH, Lazzerini Denchi E. Identification of modulators of the ALT pathway through a native FISH-based optical screen. Cell Reports. 2025;44:115114. doi: 10.1016/j.celrep.2024.115114. - DOI - PMC - PubMed
    1. Barefield C, Karlseder J. The BLM helicase contributes to telomere maintenance through processing of late-replicating intermediate structures. Nucleic Acids Research. 2012;40:7358–7367. doi: 10.1093/nar/gks407. - DOI - PMC - PubMed
    1. Barroso-González J, García-Expósito L, Hoang SM, Lynskey ML, Roncaioli JL, Ghosh A, Wallace CT, de Vitis M, Modesti M, Bernstein KA, Sarkar SN, Watkins SC, O’Sullivan RJ. RAD51AP1 is an essential mediator of alternative lengthening of telomeres. Molecular Cell. 2020;79:202006026. doi: 10.1016/j.molcel.2020.06.026. - DOI - PMC - PubMed

Associated data