. 2025 Aug 1:14:RP105430.
doi: 10.7554/eLife.105430.

Meteorins regulate the formation of the left-right organizer and the establishment of vertebrate body asymmetry

Affiliations

Meteorins regulate the formation of the left-right organizer and the establishment of vertebrate body asymmetry

Fanny Eggeler et al. Elife. .

Abstract

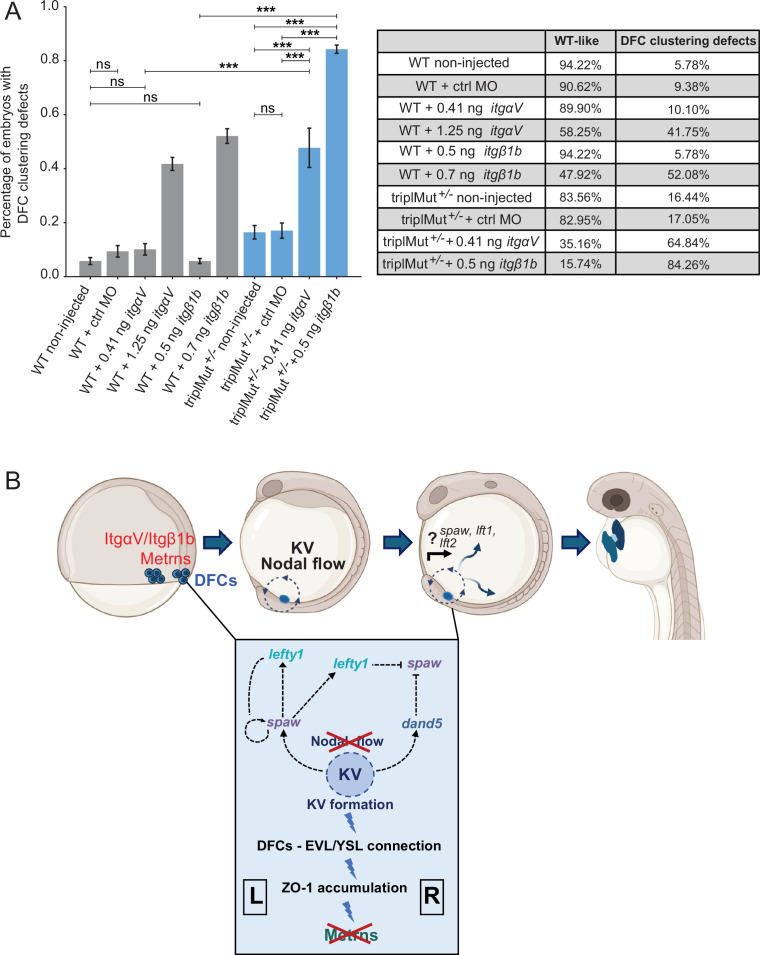
While the exterior of vertebrate bodies appears bilaterally symmetrical, internal organ positioning and morphology frequently exhibit left-right (L-R) asymmetries. In several vertebrates, including human, mouse, frog, and zebrafish, left-right symmetry-breaking during embryonic development is initiated by a ciliated organ called the Node or left-right organizer. Within the Node, a leftward flow of extraembryonic fluid named the Nodal flow mediates the asymmetric expressions of Nodal factors. Although downstream Nodal pathway components leading to the establishment of the embryonic left-right axis are well known, less is known about the development and formation of the embryonic Node itself. Here, we reveal a novel role for the Meteorin protein family in the establishment of the left-right axis and in the formation of Kupffer's vesicle, the Node equivalent structure in zebrafish. We show that the genetic inactivation of each or all three members of the zebrafish Meteorin family (metrn, metrn-like a, and metrn-like b) leads to defects in properties of the Kupffer's vesicle, caused by impaired assembly and migration of the Kupffer's vesicle forming dorsal forerunner cells. In addition, we demonstrate that Meteorins genetically interact with integrins ItgαV and Itgβ1b, regulating the dorsal forerunner cell clustering, and that meteorins loss-of-function results in disturbed Nodal factor expression and consequently in randomized or symmetric heart looping and jogging. These results identify a new role for the Meteorin protein family in the left-right asymmetry patterning during embryonic vertebrate development.

Keywords: Meteorin; developmental biology; embryonic development; left-right asymmetry; zebrafish.


Conflict of interest statement

FE, JB, LB, KD, TA, SA No competing interests declared, FD is affiliated with ZeClinics SL. The author has no other competing interests to declare, FD Reviewing editor, eLife

Figures

Figure 1.
Figure 1.. Metrns loss-of-function causes heart jogging/looping and visceral organ positioning defects.
(A) 48 hpf triplMut zebrafish display no gross phenotypic defects compared to wild type (WT) embryos. (B) Examples of 48 hpf embryos showing mRNA expression of the heart marker myl7 and the different heart looping phenotypes (ventral view). (C) Quantification in percentage of heart looping phenotypes at 48 hpf in WT, triplMut, metrn-/-, metrnla-/-, metrnlb-/-, triplMut+/- embryos; displayed p-values compared to WT: ****p-value:<1.0e-5 for triplMut, ****p-value:<1.0e-5 for metrn-/-, ****p-value:<1.0e-5 for metrnla-/-, *p-value: 0.003 for metrnlb-/-, ns p-value: 0.49 for triplMut+/-, p-value compared to metrnlb-/-: *p-value: 0.034 for triplMut+/- (not displayed). (D) Example of 56 hpf embryos showing gata6 mRNA expression highlighting the different visceral organ positioning phenotypes (ventral view). (E) Quantification in percentage of visceral organ positioning phenotypes at 56 hpf in WT and triplMut embryos, ***p-value: 0.00034. In (B) L=left, R=right. In (D) L=liver, P=pancreas, I=intestine. Scale bars in (A): 3mm, (B): 100 μm, (D): 500 μm.
Figure 1—figure supplement 1.
Figure 1—figure supplement 1.. (A–C) Metrn genes CRISPR/Cas9 mediated knockout generation and validation. (D) Metrns loss-of-function effect on heart morphology.
(A) Targeted metrns loci in the zebrafish genome for knockout generation. Red highlights the sgRNA homologous sequence, and PAM sequences are highlighted in green. The generated mutation is indicated below by dashed lines, and the number of deleted nucleotides is indicated after the D sign. (B) Metrn, metrnla, and metrnlb expression in triplMut embryos from two-cell stage to 1 day post fertilization (dpf) is highly reduced or undetectable by in situ hybridization (lateral views). (C) Metrns expression levels are reduced in triplMut embryos as shown by qRT-PCR analysis of metrn, metrnla, and metrnlb expression level at 14 hpf for metrn and metrnla and at 48 hpf for metrnlb in wild type (WT) and triplMut embryos. (Student t-test, ***p-value: 3.1e-06 for metrn; *p-value: 0.014 for metrnla; *p-value: 0.04 for metrnlb). Error bars indicate standard deviation. (D) Quantification in percentage of the number of embryos with S-looped, D-looped, or mild/no looped heart phenotypes at 2 dpf upon injection of metrnla mRNA, metrn mRNA, or both in triplMut embryos. Displayed p-values compared to WT: ****p-value:<1.0e-5 for metrnla mRNA, ****p-value:<1.0e-5 for metrn mRNA, ****p-value:<1.0e-5 for metrn +metrnla mRNA. Scale bar in (B) 250 μm. Source data for Figure 1—figure supplement 1 provided in “Figure 1—figure supplement 1—source data 1”.
Figure 2.
Figure 2.. Metrns are required for proper Nodal factor gene expression.
(A) qRT-PCR analysis for dand5, spaw, lft1, and lft2 expression in 14 hpf wild type (WT) and triplMut embryos (Student t-tests, ***p-value: 0.00019 for dand5; *p-value: 0.014 for spaw; ***p-value: 0.0004 for lft1; ***p-value: 0.00019 for lft2). Error bars indicate standard deviation. (B) Dorsal view of 16 hpf triplMut, metrn-/-, and metrnla-/- embryos with reduced expression of spaw, lft1, and lft2 as revealed by in situ hybridization. (C) Dand5 expression at 14 hpf as revealed by in situ hybridization showing different transcripts distribution of dand5 mRNA. (D) Quantification in percentage of dand5 expression phenotypes at 14 hpf in WT and triplMut embryos, ****p-value:<1.0e-5. Scale bar in (B): 250 μm, in (C): 100 μm; L=left, R=right. Source data for Figure 2A provided in ‘Figure 6—figure supplement 2—source data 1’.
Figure 2—figure supplement 1.
Figure 2—figure supplement 1.. Nodal factors gene expression is altered in the absence of Metrns.
Quantification of the number of embryos in percentage with reduced, inverted, or wild type (WT) -like dand5 expression pattern in 14 hpf triplMut+/-, metrn-/-, and metrnla-/- embryos, compared to WT. Permutation test, ****p-value <1.0e-5 for triplMut+/-, ****p-value <1.0e-5 for metrn-/-, ****p-value <1.0e-5 for metrnla-/-.
Figure 3.
Figure 3.. Metrns are expressed during early zebrafish development.
(A) Expression patterns of metrn, metrnla, and metrnlb during early embryonic development from two-cell stage to 12 hpf. (9 hpf and 12 hpf dorsal view) (B) Confocal cross-section of the midline region of 12 and 14 hpf zebrafish embryos showing mRNA expression of the metrn (magenta) and metrnla (cyan) and their co-expression in the area of the Kupffer’s vesicle (KV, indicated by arrowheads) by HCR. (C) Metrn and sox32 are co-expressed by dorsal forerunner cells (DFCs) as shown by double fluorescence in situ hybridization against metrn (magenta) and sox32 (cyan) on 10 hpf wild type embryos. (D) Metrnla and sox32 are co-expressed by DFCs as shown by double fluorescence in situ hybridization against metrnla (magenta) and sox32 (cyan) on 10 hpf wild type embryos. Scale bars in (A): 500 μm, (B) 250 μm, (C) and (D): 50 μm. L=left, R=right.
Figure 3—figure supplement 1.
Figure 3—figure supplement 1.. Metrns expression during early zebrafish and chick development.
(A) No expression can be detected for metrn, metrnla, and metrnlb upon in situ hybridization using sense metrn, metrnla, and metrnlb riboprobes on two-cell stage wild type embryos. (B) Metrn expression at 10 hpf can be found in the leading edge of the shield and in the forming Kupffer’s vesicle as shown by in situ hybridization (dorsal view), and at 14 hpf, metrn transcripts can be detected in the area of the KV and the developing brain (later view). While metrnla at 10 hpf is expressed in the whole enveloping layer and developing midline as revealed here by in situ hybridization (dorsal view). At 14 hpf, metrnla transcripts can be found in the area of the forming KV and midline (later view). No expression can be detected for metrnlb at these stages. (C) From 24 hpf, all metrn genes are expressed in the developing central nervous system as shown by in situ hybridization (lateral views). (D) Dorsal view of metrn, metrnl, and fgf8 in situ hybridization in HH6 chick embryos reveals that metrn and metrnl are expressed around the Hensen’s node (*) and the primitive streak during chick early embryonic development. Scale bars: in (A, B, and D) 250 μm and in (C) 100 μm.
Figure 4.
Figure 4.. Metrns loss-of-function leads to DFC clustering and migration defects.
(A) Dorsal views of sox32 expression in DFCs at 9 hpf and 10 hpf (cyan) in wild type (WT) and triplMut embryos reveal DFC misclustering in triplMut embryos. (B) Quantification in fraction of embryos with DFC clustering defects at 9 hpf in WT, metrn-/-, metrnla-/-, triplMut, and triplMut+/- embryos (Fisher exact test, ***p-value: 1.6e-07 for WT vs. metrn-/-; ***p-value: 3.5e-40 for WT vs. metrnla-/-; ***p-value: 1.5e-49 for WT vs. triplMut and ***p-value: 7.9e-15 for triplMut vs. triplMut+/-). Error bars indicate standard deviation. (C) Lateral view of a schematic representation of an 8 hpf zebrafish embryo visualizing animal pole (AP) to vegetal pole (VP) dorsal forerunner cell (DFC) migration from both poles. Created with BioRender.com. (D) Tracking plots of combined DFC movement in wild type (left) and triplMut embryos (right) (n=3 embryos per condition, single embryo traces see Figure 5—figure supplement 1D) showing directed DFC movement in both conditions. Bars indicating the analyzed stretch of tracked cells along the y-axis at the beginning and end of each recording. (E) Plots for convergence (upper) and migration speed (lower) analyzed from DFC tracking data show a significant decrease in these parameters in triplMut embryos compared to WT controls. (*p-value convergence ratio: 0.0295; ***p-value for migration speed 1.217e-04) Error bars indicate standard deviation.(F–G) GFP and ZO-1 immunostainings of the dorsal margin and confocal microscopy ZY-planes (right panels) of Tg(sox17:GFP) WT and triplMut embryos at (F) 6 hpf and (G) 8 hpf (shield stage and 75% epiboly) showing the apical domains of marginal DFCs with ZO-1 enriched junction points (arrowheads) and revealing the absence of apical ZO1-enrichment and detachment from the EVl/YSL in triplMut embryos. EVL, enveloping layer; DC, deep cells; YSL, yolk syncytial layer; D, dorsal; V, ventral. Scale bars in (A): 50 μm, (F–G): 50 μm. AP = animal pole, VP = vegetal pole.
Figure 4—figure supplement 1.
Figure 4—figure supplement 1.. Metrns loss-of-function leads to DFC disorganization and migration defects.
(A) Sox32 antisense riboprobe in situ hybridization revealing DFC misclustering in 9 hpf metrn-/- and metrnla-/- embryos. (B) Quantification in percentage of the number of embryos with DFC clustering defects at 9 hpf in wild type (WT) and several metrns mutant backgrounds (Fisher exact test, ***p-value: 1.5e-05 for metrn-/- vs. metrn+/-; ***p-value: 2.5e-26 for metrnla-/- vs. metrnla+/-; ***p-value: 1.2e-13 for metrn-/- x metrnla-/- vs. metrn+/- +/- metrnla+/-; ***p-value: 2.2e-18 for triplMut vs. ♀WT x ♂triplMut and ***p-value: 2.1e-13 for triplMut vs. ♀triplMut x ♂WT). Error bars indicate standard deviation. (C) tbxta and sox17 DFC specification markers are expressed in the absence of Metrn proteins, as shown by in situ hybridization on WT and triplMut at 8 and 10 dpf, respectively. Scale bars: in (A and C) 0.5 mm.
Figure 5.
Figure 5.. Metrns loss-of-function impairs Kupffer’s vesicle formation and function.
(A) Confocal cross-section of 14 hpf wild type (WT) and triplMut counterstained with acetylated tubulin (AcTub) labeling the cilia of the Kupffer’s vesicle (KV). (B) The quantification of the cell number per KV in WT and triplMut embryos at 14 hpf shows a significant difference. (C) The KV diameter size measurement, (D) cilia number per KV quantification, and (E) individual cilia length measurement in WT and triplMut embryos at 14 hpf are all significantly decreased in triplMut (N WT: 23, N triplMut: 26, Student t-tests, ***p-value: 0.00028 for KV cell number, ***p-value: 9.7e-06 for KV diameter size, **p-value: 0.0012 for cilia number. For cilia length: average per KV and ***p-value: 5.8e-12). All error bars indicate standard deviation.(F) Single microbeads tracking in the KV of 12 hpf –14 hpf WT and triplMut embryos and the mean square displacement (MSD), revealing a directed trajectory in WT samples in contrast to triplMut, displaying short and undirected trajectories. Scale bar in (A): 20 µm.
Figure 5—figure supplement 1.
Figure 5—figure supplement 1.. Metrns loss-of-function leads to DFC disorganization and migration defects.
(A) The KV cilia number and cells per KV quantification in WT and triplMut embryos at 14 hpf show no significant difference between cilia number and KV cells (N WT: 23, N triplMut: 26, Student T-tests, n.s.: 0.67 for WT KV cells, 0.96 for triplMut KV cells). Error bars indicate standard deviation. (B) DFC migration quantification calculated as the percentage of the total embryo length at 6, 8, and 10 hpf in wild type (WT) vs. triplMut embryos. Per condition and group, 16–27 embryos were analyzed (Fisher exact test, ***p-value: 2.5e-06 for 6 hpf, ***p-value: 0.00038 for 8 hpf and ***p-value: 1.1e-08 for 10 hpf). Error bars indicate standard deviation. (C) Sox32 antisense riboprobe in situ hybridization highlighting DFC migration between 6 hpf and 10 hpf in WT and triplMut embryos (point line marks the margin of epiboly). All depicted images are dorsal views. (D) Single traces of in vivo tacked DFCs in WT control (upper panel) and triplMut (lower panel) showing the vegetal movement and convergence. (E) Quantification at 6 hpf (left plot) and 8 hpf (right plot) of DFC adjacent ZO-1 enrichment areas reveals a decrease in triplMut embryos in contrast to respective WT controls (T-test; 6 hpf *p-value: 0.043, 8 hpf *p-value: 0.028). Error bars indicate standard deviation. (F) The distance of the leading DFCs to the EVL is increased in triplMut compared to WT controls visualized at 6 hpf and 8 hpf (nested T-test, *p-value: 0.039 N=4 WT, 30 DFCs measured, triplMut N=6, 46 DFCs measured; for 6 hpf and *p-value: 0.021 N=7 WT embryos, 47 DFCs measured, N=7 triplMut, 54 DFCs measured for 8 hpf). Error bars indicate standard deviation. Scale bars: in (C) 0.25 mm.
Figure 6.
Figure 6.. Metrns and ItgαV/Itgβ1b act together for the proper clustering and migration of DFCs.
(A) Quantification in percentage of embryos with DFC clustering defects at 9 hpf in non-injected wild type (WT), WT +2.5 ng control morpholino (WT +ctrl MO), WT +insufficient doses of itgαV/itgβ1b MOs (WT +0.41 ng itgαV; WT +0.5 ng itgβ1b), WT +sufficient itgαV/itgβ1b MO doses (WT +1.25 ng itgαV; WT +0.7 ng itgβ1b), triplMut+/- non-injected, triplMut+/- + 2.5 ng ctrl MO and triplMut+/- with insufficient doses of itgαV/itgβ1b MOs (triplMut+/- + 0.41 ng itgαV; triplMut+/- + 0.5 ng itgβ1b). Fisher exact tests indicate *p-value <0.01, **p-value <0.001 and ***p-value <0.0001 and ns = not significant. Error bars indicate standard deviation. (B) Schematic representation modeling the novel role of Metrns for DFCs assembly and migration, for the proper KV formation and subsequent Nodal factors expression distribution at the base of the correct L-R axis establishment during early development. Created with BioRender.com.
Figure 6—figure supplement 1.
Figure 6—figure supplement 1.. Metrns loss-of-function impairs Kupffer’s vesicle formation and function.
(A) Dorsal views of 14 hpf wild type (WT) and triplMut embryos immunostained with ZO-1. Wild type embryos display a large KV lumen with uniform ZO-1-labeled tight junction lattice. TriplMut embryos show disturbed KV lumen and dysmorphic ZO-1 lattice. (B) WT KV cells of 14 hpf Tg(sox17:GFP) show proper polarization as visualized with anti-aPKCζ immunostaining (white arrowhead). 14 hpf TriplMut embryos, in contrast, exhibit reduced polarization (white arrowhead). (C) Tracked microbeads velocity analysis in 12–14 hpf WT and triplMut embryos. The purple line marks the mean and the standard deviation (std) for each condition (WT mean = 0.96212; std = 0.048143; triplMut mean = 0.47996; std = 0.023682). Scale bars: in (A–B) 20 μm.
Figure 6—figure supplement 2.
Figure 6—figure supplement 2.. Kita, kitb, and htr2b expression patterns during early zebrafish development.
(A) qRT-PCR analysis for itgaV and itgb1b expression in 6 hpf, 9 hpf, and 24 hpf wild type (WT) and triplMut embryos (Fisher exact tests, n.s.=non-significant, p-values: 0.95 for 24 hpf itgaV WT vs. itgaV triplMut, 0.37 for 9 hpf itgaV WT vs. itgaV triplMut, 0.92 for 6 hpf itgaV WT vs. itgaV triplMut, 0.64 for 24 hpf itgb1b WT vs. itgb1b triplMut, 0.7 for 9 hpf itgb1b WT vs. itgb1b triplMut, 0.46 for 6 hpf itgb1b WT vs. itgb1b triplMut). Error bars indicate standard deviation. (B) At 9 hpf, kita is expressed in the prechordal plate (black arrowhead, dorsal view) and from 11 hpf in the lateral borders of the anterior neural plate (black arrowhead, lateral view). Kitb expression could be detected from 11 hpf in the anterior ventral mesoderm (black arrowhead, lateral view). (C) At 9 hpf, htr2b is not yet expressed. From 2 days post-fertilization (dpf), htr2b transcripts could be detected in the developing heart (black arrowhead, lateral views). (D) Phylogenetic tree of Metrn proteins. (Scale bar indicates number of amino acids substitutions per site). Scale bars: in (B – C) 250 μm. Source data for Figure 6—figure supplement 2A provided in ‘Figure 6—figure supplement 2—source data 1’.

Update of

  • doi: 10.1101/2023.11.23.568438
  • doi: 10.7554/eLife.105430.1
  • doi: 10.7554/eLife.105430.2

Similar articles

References

    1. Ablooglu AJ, Tkachenko E, Kang J, Shattil SJ. Integrin alphaV is necessary for gastrulation movements that regulate vertebrate body asymmetry. Development. 2010;137:3449–3458. doi: 10.1242/dev.045310. - DOI - PMC - PubMed
    1. Alexander J, Rothenberg M, Henry GL, Stainier DYR. casanova plays an early and essential role in endoderm formation in zebrafish. Developmental Biology. 1999;215:343–357. doi: 10.1006/dbio.1999.9441. - DOI - PubMed
    1. Amack JD, Yost HJ. The T box transcription factor no tail in ciliated cells controls zebrafish left-right asymmetry. Current Biology. 2004;14:685–690. doi: 10.1016/j.cub.2004.04.002. - DOI - PubMed
    1. Anisimova M, Gascuel O. Approximate likelihood-ratio test for branches: A fast, accurate, and powerful alternative. Systematic Biology. 2006;55:539–552. doi: 10.1080/10635150600755453. - DOI - PubMed
    1. Bisgrove BW, Essner JJ, Yost HJ. Multiple pathways in the midline regulate concordant brain, heart and gut left-right asymmetry. Development. 2000;127:3567–3579. doi: 10.1242/dev.127.16.3567. - DOI - PubMed

Substances

LinkOut - more resources