. 2025 Jan 2;19(1):wraf164.
doi: 10.1093/ismejo/wraf164.

Rapid water flow triggers long-distance positive rheotaxis for thermophilic bacteria

Affiliations

Rapid water flow triggers long-distance positive rheotaxis for thermophilic bacteria

Naoki A Uemura et al. ISME J. .

Abstract

Bacteria thrive in nearly all environments on Earth, demonstrating remarkable adaptability to physical stimuli, as well as chemicals and light. However, the mechanisms by which bacteria locate and settle in ecological niches optimal for their growth remains poorly understood. Here, we show that Thermus thermophilus, a highly thermophilic non-flagellated species of bacteria, exhibits positive rheotaxis, navigating upstream in unidirectional rapid water flow. Mimicking their natural habitat at 70°C with a water current under optical microscopy, cells traveled distances up to 1 mm in 30 min, with infrequent directional changes. This long-distance surface migration is driven by type IV pili, facilitating vertical attachment at the cell pole, and shear-induced tilting of the cell body, resulting in alignment of the leading pole toward the direction of water flow. Direct visualization of type IV pili filaments and their dynamics revealed that rheotaxis is triggered by weakened attachment at the cell pole, regulated by ATPase activity, which was further validated by mathematical modeling. Flow experiments on 15 bacterial strains and species in the Deinococcota (synonym Deinococcus Thermus) phylum revealed that positive rheotaxis is highly conserved among rod-shaped Thermaceae, but absent in spherical-shaped Deinococcus. Our findings suggest that thermophilic bacteria reach their ecological niches by responding to the physical stimulus of rapid water flow, a ubiquitous feature in hot spring environments. This study highlights unforeseen survival strategies, showcasing an evolutionary adaptation to a surface-associated lifestyle where swimming bacteria would otherwise be swept away.

Keywords: Deinococcota; extremophiles; microfluidics; rheotaxis; twitching motility; type IV pili.


Conflict of interest statement

The authors declare no conflict of interest.

Figures

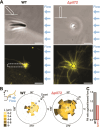
Graphical Abstract
Graphical Abstract
Figure 1
Figure 1
Rheotaxis of T. Thermophilus. (A) Schematic diagram of the experimental setup. Water flow was applied from the right side of the fluid chamber using a syringe pump. Cell behaviors were observed at 70°C under an optical microscope. (B) Time course of cell displacements in response to water flow. Dash and solid lines show the average and the median displacement, respectively. The shaded area indicates the standard deviation (SD) of biological replicates (n = 50 cells). Vertical and horizontal cells are manually categorized by the morphological appearance under the water flow, and shown in yellow and gray, respectively. Under nutrient-free conditions, both vertical and horizontal cells were observed, and the cell displacement were analyzed by grouping the cells based on their orientation. (C) Field view of cell behavior under a water flow of 40 μm/s in nutrient-free conditions. Cell trajectories for 1 min are overlayed on a dark-field microscopy image captured at time zero. Yellow and grey lines indicate trajectories of vertical and horizontal cells, respectively. Scale bar, 20 μm. (D) Proportion of cell behaviors in water flow (n = 81 cells). White: Positive rheotaxis (displacement ≥1 μm/min with trajectory angles ≤60° relative to upstream direction). Dark grey: Negative rheotaxis (displacements for ≥1 μm/min with trajectory angles ≥120°). Black: Random motility (other trajectories). (E) Cell orientation under water flow. Upper: Dark-field images of vertical and horizontal cells. Scale bar, 5 μm. Lower: Proportion of cell orientation in nutrient-free (n = 45 cells) and nutrient-rich condition (n = 65 cells). Vertical cell: Surface attachment via one pole for ≥10 s. horizontal cell: Longitudinal cell axis lying near the surface. Vertical and horizontal cells are manually categorized by the morphological appearance under the water flow, and shown in yellow and gray, respectively. (F) Cell displacements and orientations in the x-y plane relative to the flow direction under nutrient-free condition (n = 50 cells). Circles represent biological replicates, and boxplots show the median with 25%/75% quantiles. (G) Single cell trajectory during positive rheotaxis. The trajectory for 78 min at 1-min intervals is overlaid on the image captured at time zero. The start position is marked by a yellow circle. Scale bar, 100 μm. Inset: Cell aggregation initiated by horizontal cells in 32 min. Scale bar, 10 μm. (H) Schematic of cell behavior under water flow in nutrient-free and nutrient-rich conditions.
Figure 2
Figure 2
Rheotaxis depends on T4P machinery. (A) Phase-contrast images of T. Thermophilus WT and T4P mutants. Triangles indicate vertical cells. Scale bar, 10 μm. (B) Proportion of cell orientation in T4P mutants. n = 45 (WT), 60 (ΔpilA), 92 (ΔpilT1), 75 (ΔpilT2), 85 (ΔpilT1pilT2) cells. Classifications follow Fig. 1E. (C) Rheotaxis velocity of vertical cells in T4P mutants at a water flow of 40 μm/s. positive values indicate upstream movement. Circles represent biological replicates, and boxplots show the median with 25%/75% quantiles. n = 20 (WT, ΔpilT1, and ΔpilT2) and 15 (ΔpilT1pilT2) cells. (D) Time-lapse images of WT and ΔpilT2 cells under water flow. Cell trajectories for 4 min at 30-s intervals are overlaid on the last image. Water flow was applied from the right side starting at 1 min. Scale bar, 10 μm. (E) Flapping motion of vertical cells in WT and ΔpilT2 without water flow. Left: Schematic of flapping motion analysis, where the unattached pole position is determined relative to the attached pole. Right: Distribution of the unattached pole position for 30 s (n = 450 from 15 cells at 1-s intervals). (F) Proportion of responses to water flow at varying velocities in vertical cells of WT and ΔpilT2. Responses are classified into five categories in the left schematics. Rheotaxis: Upstream displacement ≥1 μm/min within trajectory angles ≤60°. Dragged: Downstream displacement ≥1 μm/min within ≥120°. Detached: Downstream displacement ≥13 μm/min within ≥120°. Stationary: Displacement ≤1 μm/min along flow direction and ≤ 5 μm/min perpendicular. Detached: 3-min displacement for ≥3 μm along, and ≤ 10 μm perpendicular. Free movement: Other trajectories. n = 30 cells at each flow velocity.
Figure 3
Figure 3
Visualization of T4P filaments by immunofluorescence microscopy. (A) Phase-contrast (top) and PilA immunofluorescence (bottom) images of vertical cells in WT and ΔpilT2. Cells were chemically fixed under water flow applied from the right in nutrient-free conditions. White and black dashed lines outline the cell body. Schematic of cell orientations are shown in the upper left of each image. Scale bar, 3 μm. (B) Length and angular distribution of T4P filaments in vertical cells. Left: Schematic image defining filament angle θ relative to the flow direction and filament length L. right: Rose plot displays the distribution of T4P filaments, and lengths in WT and ΔpilT2 (n = 11 cells for each strain). (C) Ratio of T4P filaments oriented against versus toward the flow direction. The ratio was calculated as the number of T4P filaments distributed within the 0–90° and 270–360° range relative to the number within the 90–270° in WT and ΔpilT2 (n = 84 and 148 T4P filaments from 11 cells of WT and ΔpilT2).
Figure 4
Figure 4
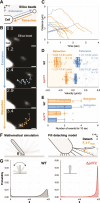
Visualization of T4P dynamics via nanobeads. (A) Schematic of the bead assay. T4P dynamics were visualized using fluorescent silica beads attached to T4P filaments. Bead movements were observed near the leading pole of horizontal cells in nutrient-free conditions. (B) Bead trajectory, captured under dark-field microscopy, showing movement away from and toward the cell pole for 3.4 s. scale bar, 1 μm. (C) Time course of bead displacement relative to the cell pole in WT. blue and orange lines represent bead movements away from and toward the cell pole (n = 12 beads from 12 cells). (D) Velocity of bead movement in WT and ΔpilT2. Positive values show movement away from the cell pole. Directional bead movements for more than 0.5 s at the leading pole were used for data analyses. Circles indicate biological replicates, and boxplots display the median and 25%/75% quantile (n = 34, 19, 16, 22 for away from and toward the cell pole in WT and ΔpilT2. n = 8 cells for each strain). (E) Frequency of directional bead movements in WT and ΔpilT2. Frequency was measured for 10 s after the first event. Circles indicate biological replicates, and bars represent average and SD (n = 10 cells for each strain). (F) Schematic of mathematical simulation. Left: Angle between the cell body and the surface over time is calculated. Right: The model of simulation assumes pili detach when the applied force exceeds the retraction force limit Frmax. (G) Angle distribution from the mathematical simulation in WT and ΔpilT2. Parameters for WT and ΔpilT2 used in the simulations are listed in Tables S3 and S4. Data represent n = 5 × 106 from 500 cells over 1000 s at 0.1-s intervals. Insets show schematic of cell behaviors.
Figure 5
Figure 5
Twitching motility and rheotaxis in Deinococcota. (A) Phylogenetic tree and isolation locations of Deinococcota. Upper left: World map showing the isolation site of each strain. Right: The phylogenetic tree is based on 16S ribosomal RNA sequences with Chloroflexus aurantiacus as an outgroup. Yellow and red branches correspond to Thermaceae and Deinococcus, respectively. Growth temperature and phase-contrast images of each strain are shown. Scale bar, 3 μm. (B) Twitching motility assay. Diffusion coefficient of the cell movements over glass surfaces in the absence of water flow (see more details in Fig. S12). (C) Rheotaxis velocity. Positive values indicate upstream movement at a flow velocity of 40 μm/s. distribution, average, and SD of biological replicates are presented. (D) Proportion of vertical cells in rod-shaped strains. Yellow and gray colors represent vertical and horizontal cells, respectively. See Table S5 for sample size.

Similar articles

References

    1. Keegstra JM, Carrara F, Stocker R. The ecological roles of bacterial chemotaxis. Nat Rev Microbiol 2022;20:491–504. 10.1038/s41579-022-00709-w - DOI - PubMed
    1. Wadhwa N, Berg H. Bacterial motility: machinery and mechanisms. Nat Rev Microbiol 2022;20:161–73. 10.1038/s41579-021-00626-4 - DOI - PubMed
    1. Padron GC, Shuppara AM, Palalay JJS. et al. Bacteria in fluid flow. J Bacteriol 2023;205:e0040022–2. 10.1128/jb.00400-22 - DOI - PMC - PubMed
    1. Miki K, Clapham DE. Rheotaxis guides mammalian sperm. Curr Biol 2013;23:443–52. 10.1016/j.cub.2013.02.007 - DOI - PMC - PubMed
    1. Ohmura T, Nishigami Y, Taniguchi A. et al. Near-wall rheotaxis of the ciliate Tetrahymena induced by the kinesthetic sensing of cilia. Sci Adv 2021;7:eabi5878. 10.1126/sciadv.abi5878 - DOI - PMC - PubMed

MeSH terms

LinkOut - more resources