. 2025 Sep 19;34(19):1648-1664.
doi: 10.1093/hmg/ddaf126.

Huntingtin reduction results in altered nuclear structure and heterochromatic instability

Affiliations

Huntingtin reduction results in altered nuclear structure and heterochromatic instability

Jessica C Barron et al. Hum Mol Genet. .

Abstract

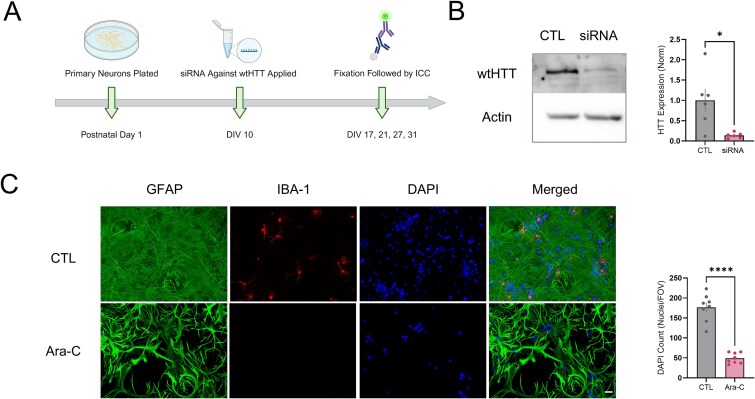
Huntington's disease (HD), a fatal neurodegenerative disease, arises due to a CAG repeat expansion in the huntingtin (HTT) gene. Non-pathogenic wild type HTT (wtHTT) is essential for neurodevelopment as well as many vital cellular functions within the adult brain; however, the consequences of wtHTT reduction in adulthood and particularly in extrastriatal regions of the brain have not been well characterized. Understanding the implications of wtHTT loss is essential as numerous genetic therapies for HD non-specifically reduce the expression levels of both mutant and wtHTT. The aim of the current study was to characterize the effect of wtHTT reduction from the whole cell to synaptic level in primary hippocampal neurons using conventional and super-resolution imaging methods. Our results identified the nucleus as an organelle that is particularly vulnerable to wtHTT reduction, with hippocampal neurons exhibiting increased nuclear size relative to the soma, DNA decompaction and a progressive loss of heterochromatin, and biphasic changes in nuclear pCREB signaling following siRNA-mediated wtHTT knockdown. Other structural assessments including dendritic complexity, spine density and synaptic morphology appeared to be largely unaffected in our wtHTT-lowered cells. These findings highlight the nucleus as an organelle that may be particularly sensitive to huntingtin-lowering in the mammalian brain.

Keywords: Chromatin; Epigenetics; Huntingtin; Huntington’s disease; Transcription.


Figures

Figure 1
Figure 1
(A) schematic of primary hippocampal culture treatment protocol created using BioRender. (B) left: Total protein from DIV 17 primary hippocampal neurons was collected and wtHTT levels were assessed using western blot. Right: Normalized wtHTT protein levels relative to actin control values. (C) left: Representative GFAP, IBA-1 and DAPI stained cells with or without Ara-C treatment to show mixed neuron and astrocyte culture composition. Scale bar represents 20 μm. Right: Analysis of nuclei per field of view (FOV). Data were assessed by unpaired t-tests and are represented as mean ± SEM. *P < 0.05, ****P < 0.0001.
Figure 2
Figure 2
(A) dendritic segments before and after super-resolution radial fluctuations (SRRF) processing to visualize postsynaptic and presynaptic sites, PSD-95 and synaptophysin (SYP), respectively. Scale bar represents 5 μm. (B) analysis of SYP puncta density values. (C) analysis of PSD-95 puncta size values. D analysis of PSD-95 puncta intensity values. E analysis of PSD-95 puncta density values. Data were assessed by unpaired t-tests and Mann–Whitney tests and are represented as mean ± SEM. Ns: Nonsignificant.
Figure 3
Figure 3
(A) dendritic processes and spines visualized by immunocytochemical staining with MAP-2 and drebrin, respectively. Scale bar represents 10 μm. (B) analysis of drebrin area values. (C) analysis of drebrin intensity values. Data were assessed by unpaired t-tests and Mann–Whitney tests and are represented as mean ± SEM. Ns: Nonsignificant.
Figure 4
Figure 4
(A) left: Dendritic processes visualized by MAP-2 staining. Right: Corresponding ROI traces and branch points identified by Sholl analysis (FIJI). Scale bar represents 20 μm. (B) dendritic complexity values quantified using Sholl analysis. (C) area under the curve (AUC) values from Sholl complexity graphs. (D) analysis of total dendritic length quantified from manual ROI traces. Data were assessed by two-way RM ANOVAs and Mann–Whitney tests and are represented as mean ± SEM. Ns: Nonsignificant.
Figure 5
Figure 5
(A) representative MAP-2 and DAPI immunocytochemically stained primary hippocampal neurons. Nuclear to soma size ratios (N:S) were quantified from manual ROI traces. Scale bar represents 5 μm. (B) analysis of N:S ratios. Data were assessed by unpaired t-tests and Mann–Whitney tests and are represented as mean ± SEM. **P < 0.01, ***P < 0.001.
Figure 6
Figure 6
(A) representative 3D DAPI stained nuclei and heterochromatic foci imaged by Airyscan microscopy. Foci were identified using Imaris software based on thresholding DAPI hotspots to average nuclear intensity levels. Scale bar represents 3 μm. (B) representative examples of enlarged DAPI hotspots. Scale bar represents 1 μm (C) analysis of foci density. (D) analysis of foci volume. (E) analysis of total heterochromatin. (F) analysis of foci intensity. (G) analysis of foci sphericity. Data were assessed by unpaired t-tests and Mann–Whitney tests and are represented as mean ± SEM. *P < 0.05, **P < 0.01.
Figure 7
Figure 7
(A) representative beta III tubulin, DAPI and phosphorylated CREB (pCREB) immunostained cells used to quantify nuclear to cytosolic (N:C) pCREB intensity ratios. Scale bar represents 5 μm. (B) analysis of N:C pCREB intensity ratios. Data were assessed by unpaired t-tests and Mann–Whitney tests and are represented as mean ± SEM. **P < 0.01, ****P < 0.0001.
Figure 8
Figure 8
(A) representative beta III tubulin, DAPI and H3K9me3 immunostained cells. Scale bar represents 20 μm. (B) analysis of nuclear intensity levels of H3K9me3, transcriptional repression marker. Data were assessed by unpaired t-tests and are represented as mean ± SEM. *P < 0.05, *P < 0.001, ****P < 0.0001.
Figure 9
Figure 9
(A) representative examples of perfused slices immunostained with transcriptional repression marker, H3K9me3 and nuclear marker DAPI. (B) schematic of wtHTT conditional KO mouse model. (C) ratio of H3K9me3 nuclear ROI intensity to background in 1–2 month wtHTT KO mice. (D) ratio of H3K9me3 nuclear ROI intensity to background in 6–8 month wtHTT KO mice. ROIs generated using FIJI thresholding protocol. Data were assessed by unpaired t-tests and Mann–Whitney tests and are represented as mean ± SEM. *P < 0.05.

References

    1. Tabrizi SJ, Leavitt BR, Landwehrmeyer GB. et al. Targeting huntingtin expression in patients with Huntington’s disease. N Engl J Med 2019;380:2307–2316. - PubMed
    1. Kwon D. Failure of genetic therapies for Huntington’s devastates community. Nature 2021;593:180–180. - PubMed
    1. Duyao MP, Auerbach AB, Ryan A. et al. Inactivation of the mouse huntington’s disease gene homolog Hdh. Science 1995;269:407–410. - PubMed
    1. Zeitlin S, Liu JP, Chapman DL. et al. Increased apoptosis and early embryonic lethality in mice nullizygous for the Huntington’s disease gene homologue. Nat Genet 1995;11:155–163. - PubMed
    1. Nasir J, Floresco SB, O’Kusky JR. et al. Targeted disruption of the Huntington’s disease gene results in embryonic lethality and behavioral and morphological changes in heterozygotes. Cell. 1995;81:811–823. - PubMed