

Artifacts in spatial transcriptomics data: their detection, importance, prevalence, and prevention
- PMID: 40748322
- PMCID: PMC12315538
- DOI: 10.1093/bib/bbaf306
Artifacts in spatial transcriptomics data: their detection, importance, prevalence, and prevention
Abstract
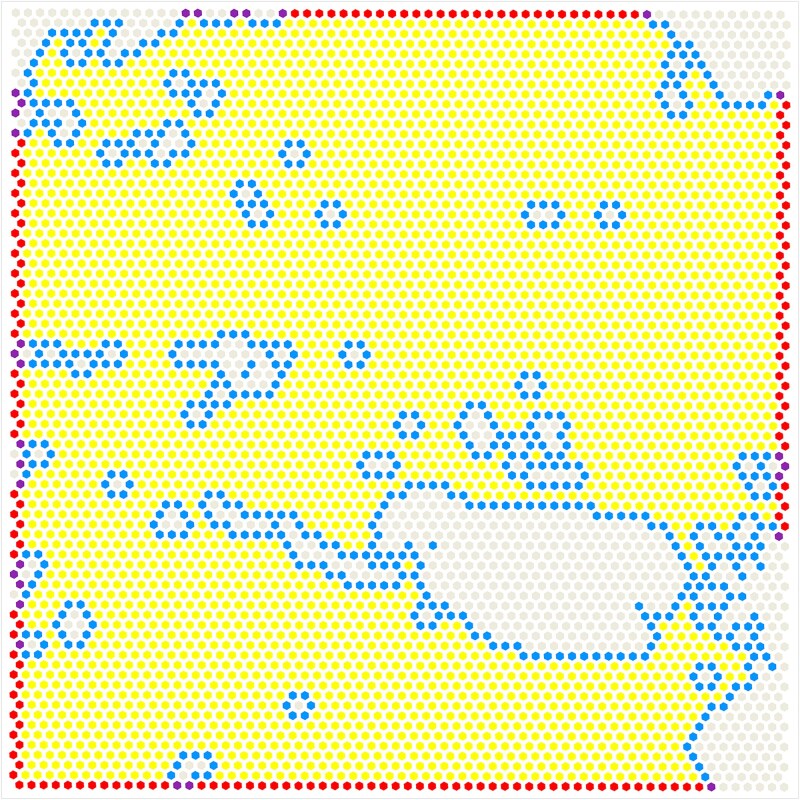
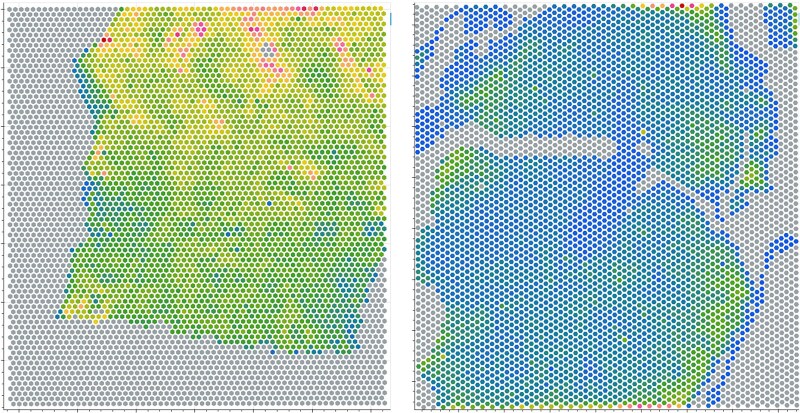
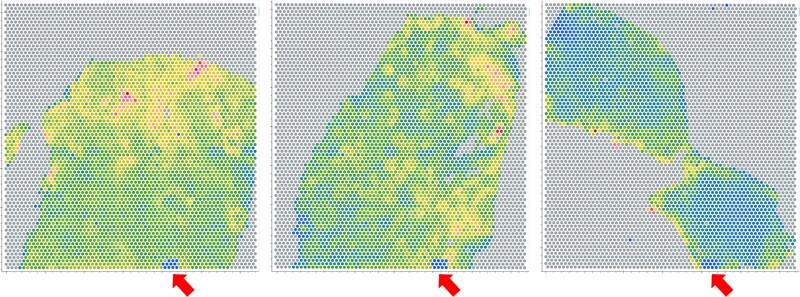
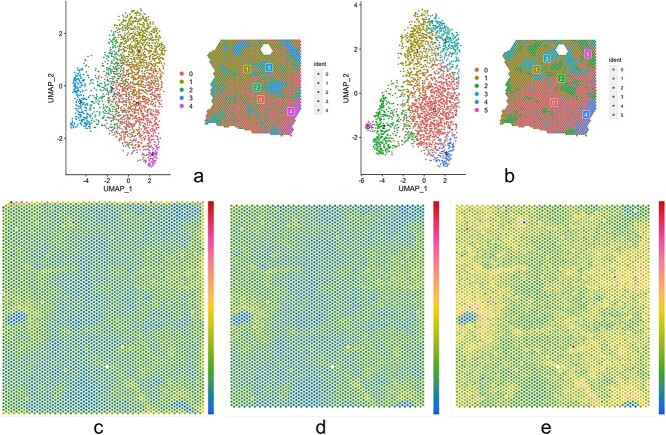
Data artifacts may induce errors in findings from any spatial transcriptomics platform. To provide protection from these errors, we have developed Border, Location, and edge Artifact DEtection (BLADE). BLADE is a novel collection of automated cross-platform statistical methods for detecting and removing three types of artifacts: (i) border effects, where total gene reads is modified at the border of the capture area; (ii) tissue edge effects, where total gene reads is modified at the edge of the tissue; (iii) location batch malfunctions, where there is a zone in the same location on all slides in a batch with substantially decreased sequencing depth. These artifacts are not mutually exclusive. BLADE has been applied to both Visium and CosMx data, and was used to evaluate our library of 37 10x Visium samples of liver and adipose tissue from humans and mice. Artifacts were found to be both common and impactful in those samples, indicating that artifact detection methods are critical for spatial transcriptomics quality control. Our BLADE software is publicly available.
Keywords: Visium; cellular senescence; modeling; quality control; spatial transcriptomics.
© The Author(s) 2025. Published by Oxford University Press.
Figures
Similar articles
-
Falls prevention interventions for community-dwelling older adults: systematic review and meta-analysis of benefits, harms, and patient values and preferences.Syst Rev. 2024 Nov 26;13(1):289. doi: 10.1186/s13643-024-02681-3. Syst Rev. 2024. PMID: 39593159 Free PMC article.
-
Antidepressants for pain management in adults with chronic pain: a network meta-analysis.Health Technol Assess. 2024 Oct;28(62):1-155. doi: 10.3310/MKRT2948. Health Technol Assess. 2024. PMID: 39367772 Free PMC article.
-
Systemic pharmacological treatments for chronic plaque psoriasis: a network meta-analysis.Cochrane Database Syst Rev. 2021 Apr 19;4(4):CD011535. doi: 10.1002/14651858.CD011535.pub4. Cochrane Database Syst Rev. 2021. Update in: Cochrane Database Syst Rev. 2022 May 23;5:CD011535. doi: 10.1002/14651858.CD011535.pub5. PMID: 33871055 Free PMC article. Updated.
-
Can a Liquid Biopsy Detect Circulating Tumor DNA With Low-passage Whole-genome Sequencing in Patients With a Sarcoma? A Pilot Evaluation.Clin Orthop Relat Res. 2025 Jan 1;483(1):39-48. doi: 10.1097/CORR.0000000000003161. Epub 2024 Jun 21. Clin Orthop Relat Res. 2025. PMID: 38905450
-
The Black Book of Psychotropic Dosing and Monitoring.Psychopharmacol Bull. 2024 Jul 8;54(3):8-59. Psychopharmacol Bull. 2024. PMID: 38993656 Free PMC article. Review.
References
MeSH terms
Grants and funding
LinkOut - more resources
Full Text Sources
