. 2025 Oct 1;31(19):4159-4173.
doi: 10.1158/1078-0432.CCR-25-1490.

Increased Peripheral T Stem Cell-like Memory Features in Patients with Advanced Solid Tumors Treated with Tumor-Targeting IL-12 Immunocytokine Therapy

Affiliations

Increased Peripheral T Stem Cell-like Memory Features in Patients with Advanced Solid Tumors Treated with Tumor-Targeting IL-12 Immunocytokine Therapy

Meghali Goswami et al. Clin Cancer Res. .

Abstract

Purpose: T-cell stemness is important for antitumor immunity. The presence in tumor-draining lymph nodes and tumor of stem-like memory T (TSCM) cells and T cells expressing the transcription factor T-cell factor 1 (TCF1), critical in T-cell self-renewal, is associated with improved response to immune checkpoint inhibitors.

Experimental design: We studied the effects of the tumor-targeting immunocytokine PDS01ADC (NHS-IL12) on peripheral T-cell stemness in murine hosts and in patients with advanced solid tumors. TSCM and expression of the murine T-cell stemness markers stem cell antigen 1 (Ly6a) and Tcf7 were evaluated in naïve and tumor-bearing mice receiving murine PDS01ADC (NHS-muIL12). Peripheral blood from patients treated in a clinical trial with PDS01ADC was analyzed for TSCM and expression of TCF1 on T-cell subsets.

Results: NHS-muIL12 treatment in naïve mice increased stem cell antigen 1-positive peripheral T cells with stem-like phenotypes and promoted tumor infiltration of CD8+ T cells displaying increased stemness. In patients with advanced solid tumors, PDS01ADC treatment increased peripheral CD8+ and CD4+ TSCM frequencies and effector memory T cells expressing TCF1, with greater increases associated with disease control. Most peripheral TSCM cells were negative for PD-1 and TIGIT throughout treatment, suggesting their quiescence and self-renewal capacity. Expanded TCF1-negative effector memory CD8+ T cells expressed PD-1 with increased intensity of granzyme B, indicating an activated, cytotoxic state.

Conclusions: PDS01ADC treatment in patients with advanced solid tumors boosts peripheral T cells with stem-like characteristics, correlating with disease stabilization. Further studies combining PDS01ADC with other immunotherapies to synergize with this peripheral burst of T-cell stemness are warranted.


Conflict of interest statement

M.T. Lynch reports other support from PDS Biotechnology during the conduct of the study. J.L. Marté reports other support from PDS Biotechnology during the conduct of the study. J.L. Gulley reports other support from PDS Biotechnology during the conduct of the study. J. Schlom reports other support from PDS Biotechnology during the conduct of the study. R.N. Donahue reports other support from PDS Biotechnology during the conduct of the study. Per the above, the National Cancer Institute has a Cooperative Research and Development Agreement with PDS Biotechnology. No disclosures were reported by the other authors.

Figures

Figure 1.
Figure 1.
Increased T-cell stemness in mice given NHS-muIL12. A, Representative flow cytometry plots of SCA1 expression on live splenic CD8+ T cells of C57BL/6 (top) and BALB/c (bottom) mice treated with PBS or NHS-muIL12. B and C, Frequencies of CD8+ TSCM and CD4+ TSCM, defined as CD44lo CD62Lhi SCA1+ BCL2+ CD122+ within CD8+ or CD4+ parent from spleens of C57BL/6 and BALB/c mice after treatment with PBS control or NHS-muIL12. D and E, Percentages of splenic CD8+ TEM and CD4+ TEM expressing SCA1 after the treatment of C57BL/6 and BALB/c mice with PBS control or NHS-muIL12. Frequencies of (F) CD8+ TSCM and (G) SCA1+ CD8+ TEM in BM after the treatment of C57BL/6 and BALB/c mice with PBS or NHS-muIL12. H, Volcano plot of differentially expressed genes in CD8+ tumor-infiltrating lymphocytes (TIL) from C57BL/6 mice bearing TC-1 tumors treated with NHS-muIL12. TILs were collected 1 day after second treatment with NHS-muIL12 and compared with PBS control, with genes above the fold change (FC) and P value cutoffs indicated by color. I, Bar plots of Cd8+ and Tcf7+Cd8+ TIL frequencies of total CD45+ filtered counts taken 1 day after third treatment. J, Expression of selected genes in tumor Tcf7+Cd8+ TILs shown by dot plot for designated treatment groups in which size reflects the percentage of cells expressing gene and color reflects average gene expression 1 day after third treatment. n = 5 mice per treatment group in C57BL/6, n = 7 mice per treatment group in BALB/c, and pooled tumors from n = 3 tumor-bearing mice per treatment group. P values < 0.05 are in bold red; P values < 0.10 are in bold. NS, not statistically significant.
Figure 2.
Figure 2.
Increases in CD8+ and CD4+ TSCM populations in adult patients with advanced solid tumors treated with PDS01ADC. A and E, Frequencies of CD8+ TSCM in patients (PT, n = 27) and CD4+ TSCM in patients (n = 26), respectively, immediately prior to therapy with PDS01ADC and age-matched healthy donors (HD, n = 10). B and F, Spearman correlation between CD8+ TSCM and CD4+ TSCM, respectively, at baseline and time in days since last systemic treatment prior to treatment with PDS01ADC. C and G, Absolute frequencies (as a percentage of live PBMCs) of CD8+ TSCM and CD4+ TSCM, respectively, at 1, 2, 4, and 8 weeks after the start of therapy. D and H, Percent changes from baseline (0 week) in CD8+ TSCM and CD4+ TSCM, respectively, at 1, 2, 4, and 8 weeks after the start of therapy. In C, D, G, and H, red lines indicate median frequencies or percent changes of paired samples (e.g., medians or percent changes at 0 weeks and 1 week of n = 10 patients with available paired samples) that significantly changed compared with baseline, whereas black lines indicate changes between paired timepoints in which P < 0.10 and gray lines indicate median changes between paired timepoints that did not significantly change. I and K, Changes in CD8+ TSCM and CD4+ TSCM, respectively, at 2 weeks and 4 weeks after the start of therapy, by response (NCB in blue on left; SD in purple on right). J and L, Changes in CD8+ TSCM and CD4+ TSCM frequencies, respectively, at 4 weeks by response. For all panels, P values < 0.05 are in bold red; P values < 0.10 are in bold.
Figure 3.
Figure 3.
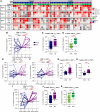
Increases in TCF1+ CD8+ and CD4+ T-cell populations in adult patients with advanced solid tumors treated with PDS01ADC. A, Heatmap of percent changes calculated against baseline in indicated TCF1+ and TCF1 T-cell subsets at 2-week and 4-week timepoints after treatment start. Dosing schedule and response indicated in legend. Percent changes are color-coded according to scale in legend. B, Percent changes from baseline in CD8+ TSCM TCF1+ at 2 weeks and 4 weeks after the start of therapy, with patients divided by response. C, Percent changes at 2 weeks in CD8+ TSCM TCF1+ in patients divided by response. D, Changes at 4 weeks in CD8+ TSCM TCF1+ in patients grouped by dosing schedule. E and F, Percent changes in indicated CD8+ TCF1+ T-cell populations at 2 weeks and 4 weeks after the start of therapy, with patients divided by response. G and H, Percent changes at 2 weeks compared with baseline in indicated CD8+ TCF1+ T-cell subsets in patients divided by response. I, Percent changes in CD4+ TSCM TCF1+ at 2 weeks and 4 weeks after the start of therapy, with patients divided by response. J, Percent changes at 2 weeks in CD4+ TSCM TCF1+ in patients divided by response. K, Changes at 4 weeks in CD4+ TSCM TCF1+ in patients grouped by dosing schedule. All percent changes are calculated against baseline. P values < 0.05 are in bold red; P values < 0.10 are in bold.
Figure 4.
Figure 4.
High-dimensional clustering of CD8+ cells in patients with advanced solid tumors before and during PDS01ADC therapy. A, Uniform Manifold Approximation and Projection (UMAP) of 1,280,044 CD8+ T cells from evaluable patients (n = 27) at all timepoints and from healthy donors, with expression of indicated markers overlaid and with relative intensity of markers indicated by scale accompanying each plot. B, Density plot of integrated UMAP of all CD8+ cells with differentiation states annotated based on expression of key markers. C, Histograms indicating relative intensity of indicated markers across 11 clusters identified through FlowSOM, with each cluster indicated by a unique color and ordered based on least differentiated (TSCM and TNV) to most differentiated (TEMRA). D, UMAP with all clusters overlaid and individual clusters indicated by color in legend. E, Heatmap of percent changes (calculated against baseline) in CD8+ clusters after treatment start. Dosing schedule and response indicated in legend. Percent changes are color-coded according to scale in legend. F, H, and J, UMAPs highlighting indicated CD8+ T-cell clusters of interest (in red) and histograms of relative TCF1 expression intensities in relation to all other clusters (in gray). G, I, and K, Percent changes in indicated CD8+ clusters at 2 weeks and 4 weeks compared with baseline in patients with NCB on the left in blue and SD on the right in purple. P values < 0.05 are in bold red; P values < 0.10 are in bold.
Figure 5.
Figure 5.
Expansion of PD-1+ TCF1+ CD8+ TSCM and PD-1+ TCF1 CD8+ TEM with PDS01ADC therapy. A, PD-1 and TIGIT expression on indicated CD8+ T-cell populations from six patients across four timepoints. Each plot shows data from all six patients at the indicated timepoint. Percentage of cells expressing PD-1, TIGIT, both, or neither indicated in each quadrant. B–D, Percent changes calculated against baseline of Boolean-gated PD-1 and TIGIT expression combinations on indicated CD8+ T-cell populations with PDS01ADC therapy through 4 weeks. Each patient is indicated by a different color. E, UMAP of 869,271 CD8+ T cells from 0-, 1-, 2-, and 4-week samples from n = 6 patients with all clusters overlaid and individual clusters indicated by color in legend, accompanied by histograms indicating relative intensity of indicated markers across all 15 clusters, with each cluster indicated by a unique color and ordered based on least differentiated (TSCM and TNV) to most differentiated (TEMRA). F, Percent changes from baseline in indicated CD8+ clusters through 4 weeks. P values < 0.05 are in bold red; P values < 0.10 are in bold. G, Uniform Manifold Approximation and Projection (UMAP) of CD8+ T cells with intensity of granzyme B expression indicated according to scale. H, Histogram of relative granzyme B intensity across all 15 clusters. I, Histograms of clusters E03 and E08 at each timepoint in all six patients. Population E09 (CD8+ TNV population) included as a granzyme B–negative comparator. Vertical lines indicate the position of peak at baseline for clusters E03 and E08, respectively. For B, C, D, and F, patients are indicated by different colors, consistent across these panels.

References

    1. Ren Z, Zhang X, Fu YX. Facts and hopes on chimeric cytokine agents for cancer immunotherapy. Clin Cancer Res 2024;30:2025–38. - PubMed
    1. Sharifi J, Khawli LA, Hu P, King S, Epstein AL. Characterization of a phage display-derived human monoclonal antibody (NHS76) counterpart to chimeric TNT-1 directed against necrotic regions of solid tumors. Hybrid Hybridomics 2001;20:305–12. - PubMed
    1. Morillon YM 2nd, Su Z, Schlom J, Greiner JW. Temporal changes within the (bladder) tumor microenvironment that accompany the therapeutic effects of the immunocytokine NHS-IL12. J Immunother Cancer 2019;7:150. - PMC - PubMed
    1. Fallon J, Tighe R, Kradjian G, Guzman W, Bernhardt A, Neuteboom B, et al. The immunocytokine NHS-IL12 as a potential cancer therapeutic. Oncotarget 2014;5:1869–84. - PMC - PubMed
    1. Minnar CM, Chariou PL, Horn LA, Hicks KC, Palena C, Schlom J, et al. Tumor-targeted interleukin-12 synergizes with entinostat to overcome PD-1/PD-L1 blockade-resistant tumors harboring MHC-I and APM deficiencies. J Immunother Cancer 2022;10:e004561. - PMC - PubMed

Substances