

Incidence and predictors of preterm neonatal mortality at public hospitals in Eastern Ethiopia: A prospective follow-up study
- PMID: 40748899
- PMCID: PMC12316275
- DOI: 10.1371/journal.pone.0327766
Incidence and predictors of preterm neonatal mortality at public hospitals in Eastern Ethiopia: A prospective follow-up study
Abstract
Introduction: Preterm birth is a major clinical problem, affecting 15 million births every year worldwide. It is the largest cause of death in children under the age of five. Even though different studies have been done regarding the incidence of preterm neonatal death in some parts of Ethiopia, there is a paucity of evidence, especially in the eastern part. Therefore, this study aimed to assess the incidence and predictors of preterm neonatal mortality at public hospitals in eastern Ethiopia from May 1, 2022, to March 30, 2023.
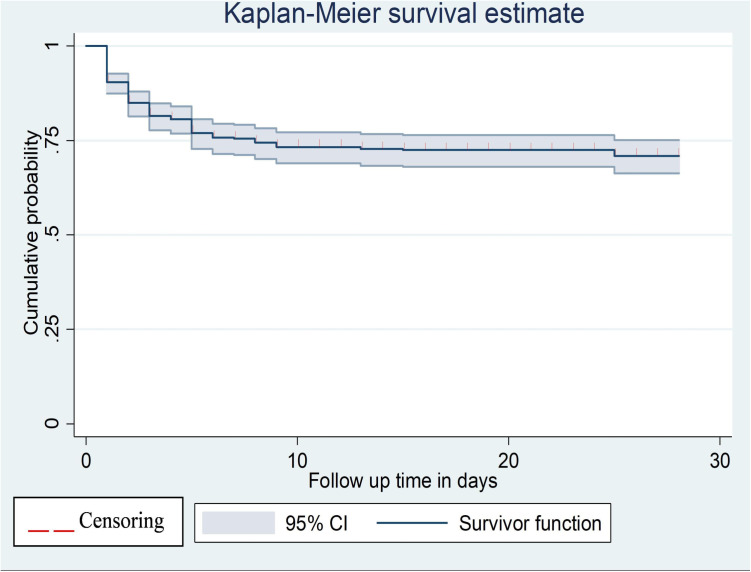
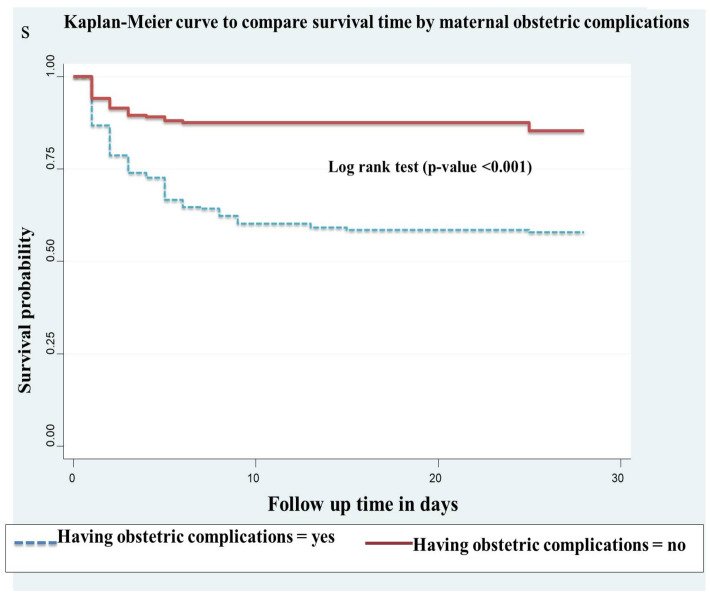
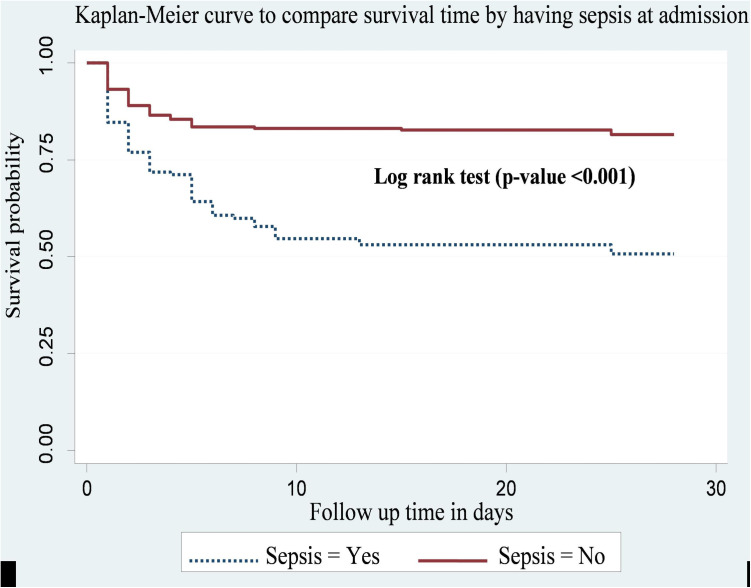
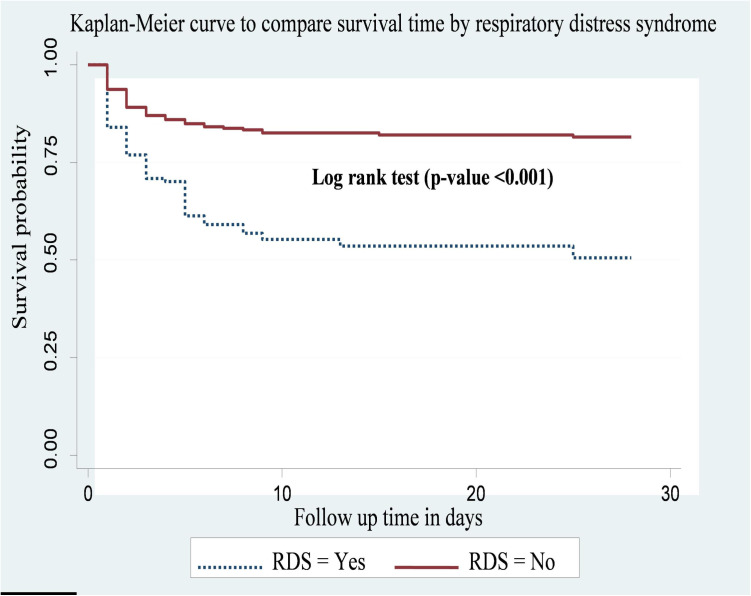
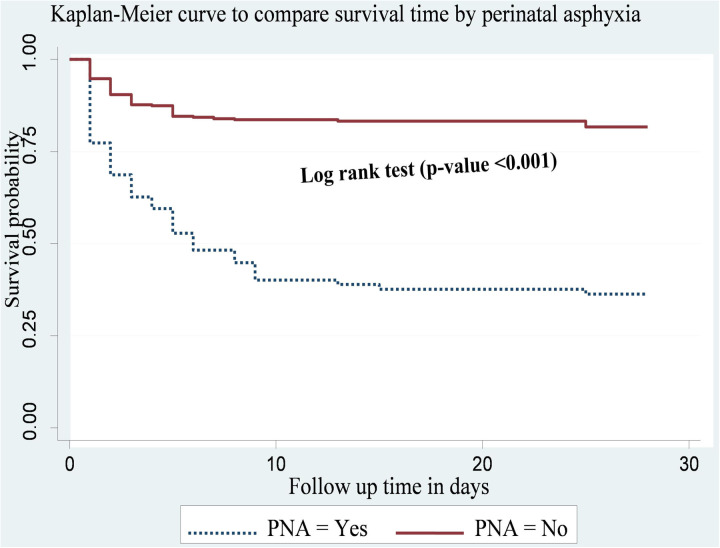
Methods: An institution-based prospective follow-up study was conducted at public health institutions from May 1, 2022, to March 30, 2023. A structured, pretested, and interviewer-administered questionnaire and checklist were used to collect the data. The data were entered into EpiData version 4.6 and then exported to STATA version 14 for analysis. Kaplan-Meier was used to estimate survival time. A log-rank test was used to compare survival curves between different categories of the explanatory variables. Descriptive analysis, bivariable, and multivariable Cox Proportional Hazards regression analysis were performed. The level of significance was declared at a p-value of <0.05.
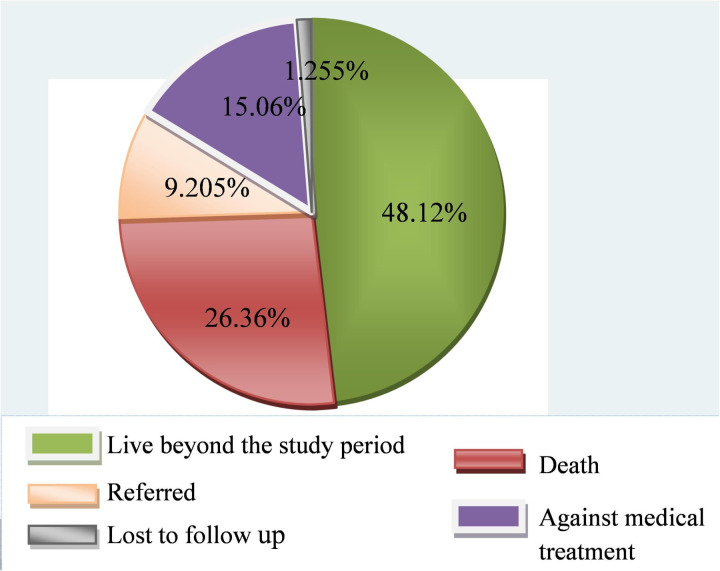
Results: The overall incidence rate of death was 17.03 (14.3, 20.28) per 1000 person-day observations. Mothers' obstetric complications (AHR: 2.27, 95% CI: (1.46, 3.54)), not crying at birth (AHR: 1.83, 95% CI: (1.09, 2.31)), not immediately initiating breastfeeding (HR: 1.59, 95% CI: (1.10, 2.31)), having sepsis (HR: 1.85, 95% CI: (1.26, 2.72)), having respiratory distress syndrome (HR: 1.98, 95% CI: (1.36, 2.90)), having perinatal asphyxia (HR: 3.1, 95% CI: (2.13, 4.51)), and an APGAR score of less than seven (HR: 2.16, 95% CI: (1.47, 3.16)) were significant predictors of preterm neonatal death.
Conclusion: This study found the high incidence rate of preterm neonatal mortality, primarily driven by preventable and manageable conditions. Strengthening early identification and timely intervention for the risk factors is critical to improving survival outcomes among preterm neonates.
Copyright: © 2025 Mengesha et al. This is an open access article distributed under the terms of the Creative Commons Attribution License, which permits unrestricted use, distribution, and reproduction in any medium, provided the original author and source are credited.
Conflict of interest statement
The authors have declared that no competing interests exist.
Figures
References
-
- WHO. Newborns: improving survival and well-being. 2020.
-
- Neonatal mortality. https://data.unicef.org/topic/child-survival/neonatal-mortality/. 2020. 2021 December 4.
MeSH terms
LinkOut - more resources
Full Text Sources
