Review
. 2025 Aug 13;125(15):6906-6976.
doi: 10.1021/acs.chemrev.4c00466. Epub 2025 Aug 1.

Anion-Exchange-Membrane Electrolysis with Alkali-Free Water Feed

Affiliations
Review

Anion-Exchange-Membrane Electrolysis with Alkali-Free Water Feed

Mohsin Muhyuddin et al. Chem Rev. .

Abstract

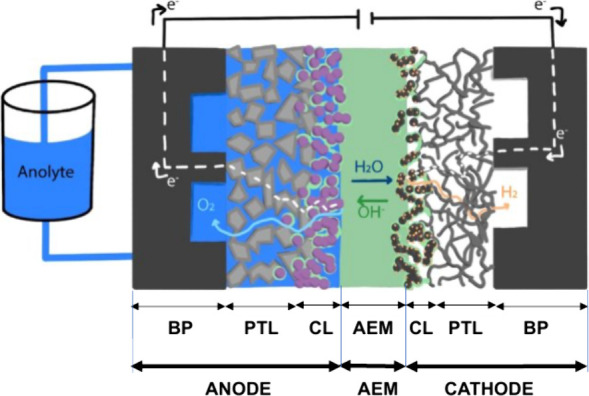
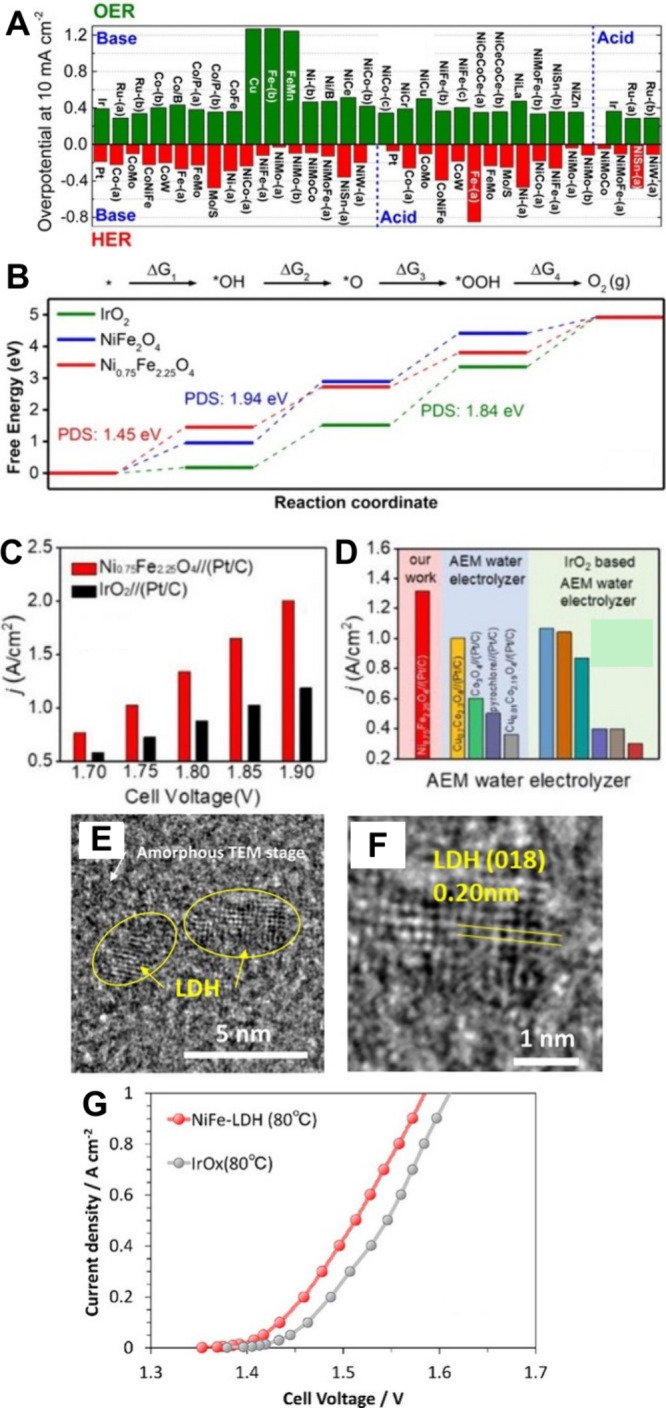
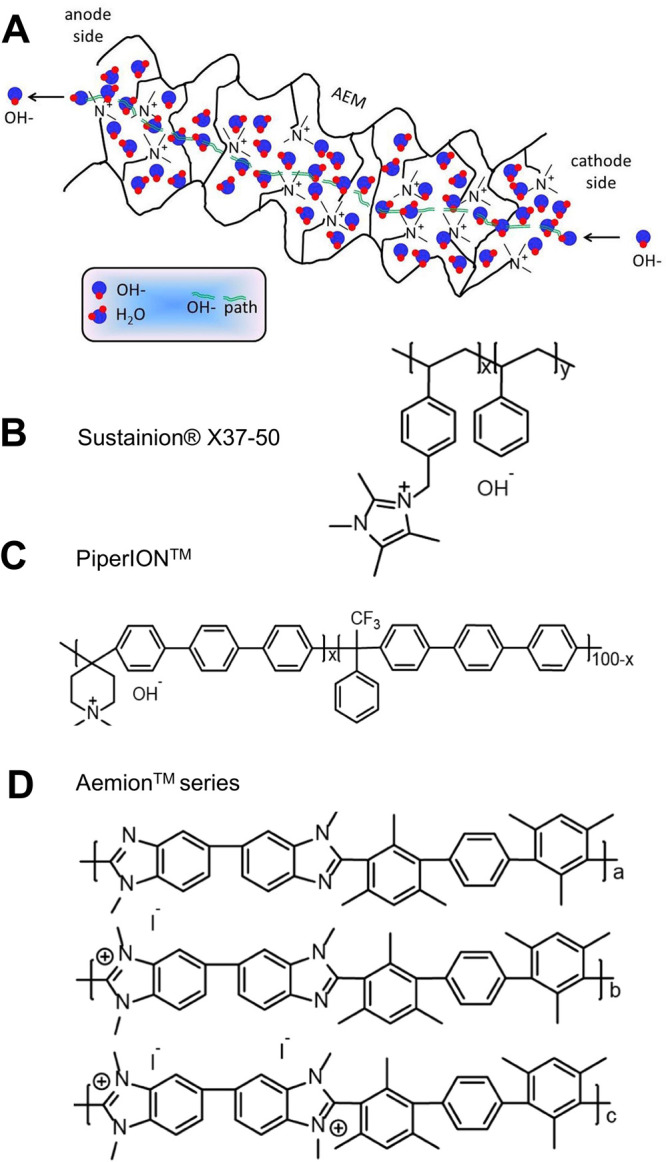
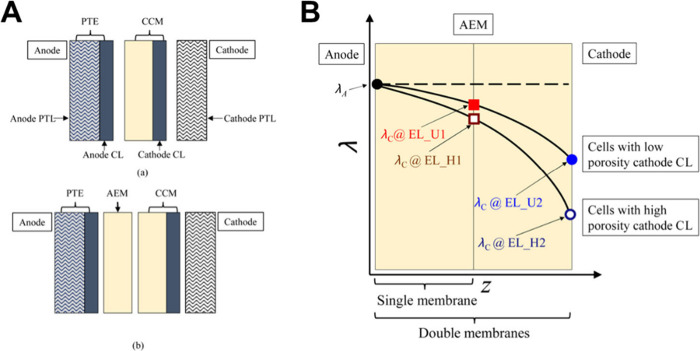
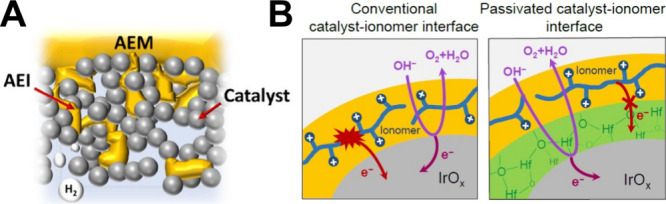
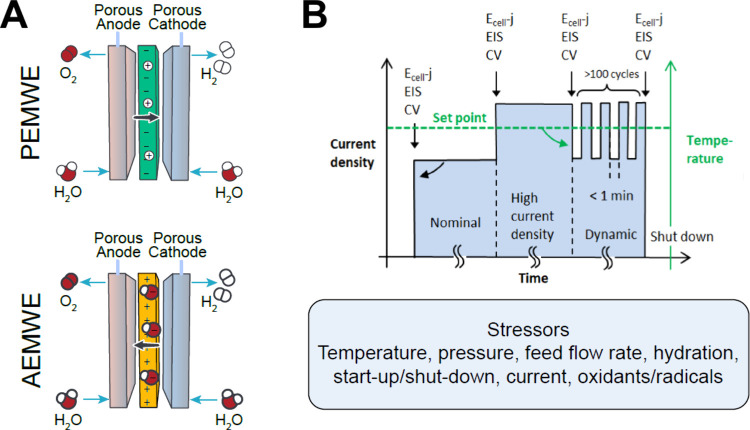
Hydrogen is a green and sustainable energy vector that can facilitate the large-scale integration of intermittent renewable energy, renewable fuels for heavy transport, and deep decarbonization of hard-to-abate industries. Anion-exchange-membrane water electrolyzers (AEM-WEs) have several achieved or expected competitive advantages over other electrolysis technologies, including the use of precious metal-free electrocatalysts at both electrodes, fluorine-free hydrocarbon-based ionomeric membranes and bipolar plates based on inexpensive materials. Contrasting the analogous proton-exchange-membrane system (PEM-WE), where pure water is circulated (no support electrolyte), the current generation of AEM-WEs necessitates the circulation of a dilute aqueous alkaline electrolyte for reaching high energy efficiency and durability. For several reasons, including but not limited to lower cost of balance-of-plant, lower operating cost and improved device's lifetime, achieving high cell efficiency and performance using an alkali-free water feed is highly desirable. In this review, we develop and build a foundational understanding of AEM-WEs operating with pure water, as well as discuss the effects of operating with natural water feeds like seawater. After a discussion of the possible advantages of pure-water-fed AEM-WEs, we cover the thermodynamic and kinetic processes involved in AEM-WE, followed by a detailed review of materials and components and their integration in the device. We highlight the influence of electrolyte composition and alkali/electrolyte-free feed on the membrane-electrode assembly, ionomers, electrocatalysts, porous transport layer, bipolar plates and operating configuration. We provide evidence for how the pure water feed engenders several issues related to the degradation of device components and propose mitigation strategies.


Figures

1
1
Schematic of low-temperature WEs. (A) A-WE, (B) PEM-WE and (C) AEM-WE. The PTL is the porous transport layer, usually a metal- or carbon-based porous layer that supports the catalytic layer (CL), which is the electrocatalytically active region of the device. The CL is composed of electrocatalyst powder or self-supported electrocatalyst surface, ionomer solid electrolyte, porosity for water and gas transport, and also for ionic conduction when a support electrolyte is used, i.e., for A-WE and some operating configurations of AEM-WE.
2
2
Annual number of publications in the field of AEMs (from Web of Science, accessed June 25, 2025). Search terms: “Anion exchange membrane”, “electrolyte-fed AEM-WE”, “water” and “electrolysis”.
3
3
Schematic of the operating configurations for AEM-WE with supporting electrolyte fed on both anode and cathode (A), or only fed to the anode side (B) or the cathode side (C). Schematic of the operating configurations for AEM-WE with pure water fed on both the anode and cathode (D), or only fed to the anode side (E) or the cathode side (F).
4
4
Cross section of a single cell AEM-WE identifying the key interfaces for electrical and ionic interconnection and particularly highlighting (A) catalyst electrical connection and utilization; (B) carbon/platinum interaction with the ionomer; (C) Hydroxide transport within the AEM; (D) pressure gradient within the catalytic layer.
5
5
Volcano plots of several transition metals for HER in (A) acidic and (B) alkaline conditions. In (A), EM‑Hads is an experimental value, an operative electrochemical adsorption heat used by Trasatti for its plot, and reprinted with permission from the work of Krishtalik, ref . Copyright 2010, American Chemical Society (ACS). In (B), EM‑Hads was calculated using DFT, reprinted with permission from ref . Copyright 2013, The Royal Society of Chemistry.
6
6
A) The dependence of the HER rate on the pH. Comparison of cyclic voltammetry scans on Pt (111) at various pH. Adapted with permission from ref . Copyright 2017, Springer Nature. B) Linear sweep voltammetry in the HER region of polycrystalline platinum in 0.1 M alkali with different cations. Modified with permission from ref . Copyright 2022 Springer Nature Limited.
7
7
Linear-sweep voltammograms of the OER region for an IrO2 electrode at various pH: pH 1–5 (A), pH 6–10 (B), pH 11–13 (C) and pH 1, 9, 13 (D). Adapted with permission from ref . Copyright 2022, Elsevier. CC-BY 4.0 license, https://creativecommons.org/licenses/by/4.0/.
8
8
Volcano plot for the OER plotted using the ΔGO* – ΔGOH* and ΔGOH* descriptors. Adapted from ref . Copyright 2022, American Chemical Society. Licensed under CC-BY-NC-ND 4.0.
9
9
Schematic of a single cell AEM-WE including the single components and their integration. Adapted from ref . Copyright 2021, IOP Publishing Limited. Licensed under CC-BY 4.0.
10
10
(A) Impact of the chemical composition of a Raney-Ni electrode on the HER overpotential at 25 A/dm2 at 25 °C. Reprinted with permission from ref . Copyright 2000, Elsevier. Published by Elsevier Science Limited. (B) Polarization curves of bare Ni foam, Co3O4 nanosheets, Co/Co3O4 nanosheets, and Pt wire. (C) Tafel plots derived from (B). (B) and (C) adapted with permission from ref . Copyright 2015, American Chemical Society. (D) Position of the different crystal surfaces of Ni x M y (M = P, S, N) in the HER activity volcano plot as a function of the calculated hydrogen adsorption-free energies. (E) “Ex-situ”current–voltage characteristics of Pt, Ni5P4, Ni3N, Ni3S2, and Ni working in 1 M KOH. (D) and (E) were adapted with permission from ref . Copyright 2016, WILEY-VCH Verlag GmbH. Morphology of HER ECs: (F) nickel foam; (G) detail of the surface of a branch; (H) surface of a branch after deposition of Ni­(OH)2, adapted with permission from ref . Copyright 2008, The Royal Society of Chemistry. (I) AEM electrolyzer cell performance at 60 °C using NiAlMo cathode and different anodes: Ni/graphite, NiAl, Ni, and NiAlMo; (J) durability test of the cell using NiAl anode for about 154 h under a current density of 1 A cm–2, reprinted with permission from ref . Copyright 2019, American Chemical Society. (K) Polarization curves for AEM electrolyzer single cells with Ni–Co–S/CP and commercial Pt/C/CP cathodes, reproduced with permission from ref . Copyright 2020, John Wiley & Sons Limited.
11
11
(A) Activity of various OER ECs (ECs) after 2 h of operation at 10 mA·cm–2, reprinted with permission from ref . Copyright 2015, American Chemical Society. (B) Free energies of OER intermediates on the IrO2(1 1 0), NiFe2O4(3 1 1) and Ni0.75Fe2.25O4(3 1 1) surfaces at U = 0 V. PDS = potential-determining step. (C) Current density at various cell voltages for Ni0.75Fe2.25O4//(Pt/C) and IrO2//(Pt/C) cells. (D) Comparison of AEM-WE for the Ni0.75Fe2.25O4//(Pt/C) cell, other reported AEM-WE cells, and the reported IrO2-based AEM-WE. (B–D) were reproduced with permission from ref . Copyright 2020, Elsevier B.V. (E, F) High-resolution TEM image of NiFe layered double hydroxide (NiFe-LDH) OER EC. (G) Current–voltage curves obtained for MEAs using (red) NiFe-LDH and (gray) IrO x at 80 °C as an anode EC. (E–G) were reproduced with permission from ref . Copyright 2020, American Chemical Society.
12
12
Schematic representation of an AEM based on a quaternary ammonium pendant functional group (A). Adapted from ref . Copyright 2017, Elsevier. Licensed under the CC BY-NC-ND 4.0. Chemical structures of selected commercial AEMs such as Sustainion X37-50 (B), PiperION (C) and Aemion series (D) adapted with permission from ref . Copyright 2022, American Chemical Society.
13
13
(A) Schematic representation of MEA structure, featuring both single and double AEM. (B) Schematic depicting the distribution of water content (λ) within the membrane in various electrolytic cells when current density ≥ 0.6 A cm–2. (A-B) were reprinted with permission from ref . Copyright 2022, Elsevier Ltd.
14
14
Ex-situ methods reported in the literature to assess the alkaline stability of AEMs. Data adapted with permission from ref . Copyright 2021, Springer Nature.
15
15
(A) Schematic diagram illustrating nucleophilic attack onto TMBA, with and without water. Figure reproduced from ref . Copyright 2017, American Chemical Society, Licensed under CC-BY 4.0. (B) Remaining TMBA fractions over time, varying with the number of water molecules per OH (λ = 0–8), in 0.6 M OH– DMSO-d6 solutions at room temperature. Figure reproduced with permission from ref . Copyright 2017, Elsevier B.V. (C) Remaining PPO–TMA fractions as a function of time with λ = 0, 4 and 8, in 0.06 M OH DMSO-d 6 solutions at room temperature. Figure reproduced from ref . Copyright 2018, Royal Society of Chemistry. Licensed under CC-BY 3.0, (D) Normalized true OH conductivity of the BTMA-LDPE AEM as a function of test time (80 °C, 100 μA, and a nitrogen flow of 500 sccm/min) at different RH levels. Figure reproduced from ref . Copyright 2020, American Chemical Society. Licensed under CC-BY 4.0.
16
16
(A) Comparison between the OH ions pathway in the anode of an AEM-WE operated with DI water (left) and with a supporting electrolyte solution (right). EC-ionomer interface is marked in black and the EC-liquid electrolyte interface is marked in red. Reproduced from ref . Copyright 2021, IOP Publishing Limited under CC BY-NC-ND 4.0 license. (B) AEM-WE performance of MEAs where AEIs with different IECs were used. (C) MEA performance comparison between HTMA-DAPP-bonded and TMA-53-bonded MEAs at 60 °C in water and 0.1 M NaOH. (B–C) were reproduced with permission from ref . Copyright 2020, Springer Nature Limited. (D) Cell voltage vs time for MEAs with various epoxy binder contents at 0.5 A cm–2. Reproduced with permission from ref . Copyright 2022, Elsevier B.V. (E) CL delamination observed without Nafion binder when exposed to DI water vs no delamination observed when Nafion binder is used; observing binder-free (i) and binder-containing (ii) electrodes in 1 M NaOH, when binder-free (iii) and binder-containing (iv) electrodes immersed in DI water, and eventually the binder-free (v) and binder-containing (vi) electrodes after being left in the DI water for several hours. Reproduced with permission from ref . Copyright 2022, Elsevier B.V.
17
17
(A) Schematic representation of MEA fabrication via CCM and CCS methods. Reproduced with permission from ref . Copyright 2021, John Wiley & Sons Limited. (B) proposed process for direct coating of an AEM with the CCM method using a bar coater. Reproduced with permission from ref . Copyright 2022, Wiley-VCH GmbH. Licensed under CC BY 4.0. (C) progression of spray coating on stainless-steel PTLs showing that slow spraying ensures ink drying between layers, and that too quick coating generates nonuniform coating with ink seeping. Reproduced with permission from ref . Copyright 2021, The Royal Society of Chemistry. (D) polarization curves showing the effect of the anode PTL type (Ni foam vs platinized Ti) on the performance of an AEM-WE fed with 1 wt % K2CO3. Reproduced with permission from ref . Copyright 2022, Elsevier B.V.
18
18
Water electrolyzer stack assembled in an (A) monopolar configuration and (B) bipolar configuration.
19
19
Logarithmic values of average concentration in seawater (blue symbols) and the maximal solubility at pH 13 (red symbols) for different cationic species.
20
20
Optical images of (A) the two electrolytes and (B) the NiMoN@NiFeN sample before and after seawater electrolysis. Figures reproduced from ref . Copyright 2019. Springer Nature. Licensed under CC-BY 4.0.
21
21
Pourbaix diagrams of H2O and (A) OCl3 , (B) OCl2 , and (C) OCl in 0.5 M Cl at 25 °C. Reproduced with permission from ref . Copyright 2020, Elsevier Inc.
22
22
Schematic of a seawater desalination plant considering pretreatment, reverse osmosis and polishing.
23
23
Polarization curves when AEM-WE fed with anolyte while keeping the cathodic counterpart dry (A) and HFR (B) as a function of KOH concentration. In the study, cathode and anode ECs were PtRu/C and IrO2, respectively, where HTMA-DAPP was employed as a membrane. (A-B) reproduced from ref . Copyright 2021, IOP. Licensed under CC BY-NC-ND 4.0. (C) Polarization curves (kinetic zone in inset) of AEM-WE operated with 1 M KOH anolyte and with different catholyte conditions: DI water, 1 M KOH, and dry with no catholyte flow. (C) reproduced from ref . Copyright 2022, IOP. Licensed under CC BY-NC-ND 4.0. AEM-WE polarizations comparing the different feeding conditions containing (D) 1 M KOH, (E) 0.1 M KOH, (F) pure water. (D–F) reproduced from ref . Copyright 2023, Elsevier B.V. Licensed under CC-BY 4.0. Comparison of polarization curves at various points when conditioning in 1 M KOH (G). Reproduced with permission from ref . Copyright 2021, American Chemical Society. AEM-WE operating at 1.0 A cm–2 and 60 °C, where the initial feed of pure DIW was incrementally switched to KOH (H). The cell was configured with IrOx OER and PtNi HER ECs having GT72–10 AEM. Polarization curves were obtained as the cell operation started with 0.3 M KOH and then at different times after switching the system to DIW feed (I). (H–I) are reproduced with permission from ref . Copyright 2022, IOP. Licensed under CC BY-NC-ND 4.0.
24
24
Polarization curves recorded in sequence in this order with different feeds: pure water at the beginning of life (BOL) and after 20 h durability test, 1% K2CO3, 0.1 M KOH, and pure water again at the end of the test (EOT) after flushing more than 2 L of pure water. Reproduced with permission from ref . Copyright 2023, Elsevier.
25
25
(A) Linear-sweep voltammograms of NiFe LDH samples with various Fe contents recorded at a scan rate of 1 mVs–1 in Fe-free 0.1 M KOH. (B–D) Comparison of (B) anodic peak potentials of Ni2+ to Ni3+, (C) current densities at an overpotential of 320 mV, and (D) Tafel slope. (E) Correlation of current densities acquired at η = 320 mV to Fe content. Adapted with permission from ref . Copyright 2020, Wiley-VCH Verlag GmbH.
26
26
Pourbaix diagram for an artificial model of seawater (A). Reproduced from ref . Copyright 2016, Wiley-VCH Verlag GmbH. Schematic illustration of an asymmetric configuration of AEM-WE with seawater feed to the cathode while circulating KOH on the anode (B). Stability trends electrolyzers with different electrolytic feeding conditions at a fixed cell potential of 1.7 V over 12 h (C). (B–C) Reproduced from ref . Copyright 2020, The Royal Society of Chemistry. Licensed under CC-BY 3.0. (D) Volcano trend of repulsion between different anions and chloride ions as a function of ionic potential and charge number. (E) Schematic illustration of corrosion-avoiding mechanism due to surface adsorption. (D-E) reproduced with permission from ref . Copyright 2022, Elsevier B.V.
27
27
Left- (A) ECs optimization (left) and electrolyte optimization (right) to protect the metal substrate from Cl corrosion; (B) stability tests recorded at a constant current of 100 mAcm–2 for pure NF in electrolytes with different proportions of Na2SO4; (C) the durability of NF in different electrolytes. (D) and (F) optical images and (E) and (G) SEM images of NF working in two different electrolytes after 0, 20, and 50 min, the dashed circles indicate the skeleton collapse by electrolyte corrosion. SEM images of the skeletons of untreated NF. Adapted with permission from ref . Copyright 2021, Wiley-VCH GmbH.
28
28
(A) Maximum performance of pure water-fed AEM-WEs. References and operational temperatures are labeled on the plot and shown in Table . (B) Degradation rate during long-term testing of pure water fed AEM-WE. References and operational temperatures are labeled on the plot and shown in Table .
29
29
(A) AEM-WE operation in different feed conditions demonstrates ionomer oxidation suppression in the presence of 0.1 M KOH. (B) XPS data show the presence of oxidized carbon after AEM-WE pure water operation, indicating ionomer oxidation. (C) Cross-sectional images of an IrOx/TP-85 anode PTE before and after operation show oxidative degradation of ionomer, causing its loss. Reproduced with permission from ref . Copyright 2023, The Royal Chemical Society
30
30
Scheme of EC (EC) layer design approaches: (A) incorporation of solid ionomer particles to facilitate ionic transport within the layer; reproduced from ref , copyright 2023, American Chemical Society and (B) incorporation of a passivation layer at the EC-ionomer interface; reproduced with permission from ref , copyright 2023, American Chemical Society.
31
31
Suggested harmonized protocol for accelerated stability testing of water electrolyzers. (A) MEA schematic of PEM-WE and AEM-WE with corresponding stressors of systems. (B) Testing protocol scheme reproduced with permission from ref . Copyright 2020, Elsevier B.V.

Similar articles

References

    1. IEA . Net Zero by 2050 - A Roadmap for the Global Energy Sector.
    1. Kovač A., Paranos M., Marciuš D.. Hydrogen in Energy Transition: A Review. Int. J. Hydrogen Energy. 2021;46(16):10016–10035. doi: 10.1016/j.ijhydene.2020.11.256. - DOI
    1. Fonseca J. D., Camargo M., Commenge J.-M., Falk L., Gil I. D.. Trends in Design of Distributed Energy Systems Using Hydrogen as Energy Vector: A Systematic Literature Review. Int. J. Hydrogen Energy. 2019;44(19):9486–9504. doi: 10.1016/j.ijhydene.2018.09.177. - DOI
    1. Thomas J. M., Edwards P. P., Dobson P. J., Owen G. P.. Decarbonising Energy: The Developing International Activity in Hydrogen Technologies and Fuel Cells. Journal of Energy Chemistry. 2020;51:405–415. doi: 10.1016/j.jechem.2020.03.087. - DOI - PMC - PubMed
    1. IEA.org.Hydrogen.

LinkOut - more resources