. 2025 Aug;11(31):eadu4270.
doi: 10.1126/sciadv.adu4270. Epub 2025 Aug 1.

Neuronal Reg3β/macrophage TNF-α-mediated positive feedback signaling contributes to pain chronicity in a rat model of CRPS-I

Affiliations

Neuronal Reg3β/macrophage TNF-α-mediated positive feedback signaling contributes to pain chronicity in a rat model of CRPS-I

Huimin Nie et al. Sci Adv. 2025 Aug.

Abstract

Complex regional pain syndrome type I (CRPS-I) develops after an initial injury. It causes prolonged pain that persists beyond the usual expected time for tissue healing. Mechanisms underlying pain chronicity of CRPS-I remain unknown. Here, we identified the presence of long-lasting infiltration of macrophages in local dorsal root ganglia (DRG) of a rat model of CRPS-I. We demonstrate that regenerating islet-derived 3β (Reg3β) is specifically produced by DRG neurons upon model establishment and functions as an important signaling molecule to drive proinflammatory macrophage infiltration in local DRG. Infiltrated macrophages produce TNF-α, which causes hyperexcitability of nociceptive DRG neurons and reciprocally promotes Reg3β overexpression and secretion from DRG neurons to recruit more macrophages. Our work reveals a positive feedback signaling conveyed by neuronal Reg3β/macrophage TNF-α that contributes to neuroinflammation in DRG, resulting in persistent pain in a rat model of CRPS-I. This finding provides insights into the neuroimmune interaction in local DRG that contributes to pain chronicity of CRPS-I.


Figures
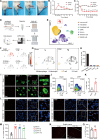
Fig. 1.
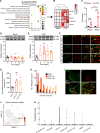
Fig. 1.. Macrophages invade in DRG of a rat model of CRPS-I.
(A) Representative photos showing hind paw of rat receiving CPIP model establishment. (B) Time course showing the thickness of ipsilateral hind paw of sham and CPIP model rats. n = 5 rats per group. (C) Time course showing 50% paw withdrawal threshold (PWT) from sham and CPIP model rats. n = 5 to 6 rats per group. (D) Flow chart of scRNA-seq. Created in BioRender. Pan, Y. (2025) https://BioRender.com/wd2ghrz. (E) UMAP plot of cell clusters identified by scRNA-seq. vSMC, vascular smooth muscle cell. (F) Cell populations identified from immune cell cluster by marker genes. (G) Distribution of specific immune cell population (including macrophages, neutrophils, and T or B cells) in DRG of sham versus CPIP model rats. (H) Summary of increase in the number of cells in DRG after CPIP modeling. (I) CD68 (red, marker for macrophage) and NeuN (green, marker for neuron) immunostaining in ipsilateral L4-L6 DRG from sham and CPIP groups. Scale bar, 50 μm. (J) Flow cytometry of macrophages expressing CD68 in cell suspensions from DRG of sham and CPIP groups on day 7. A total of 10,000 cells were analyzed for each. (K) Summary of the percentage of CD68+ cells in DRG as in (J). n = 3 to 4 rats per group. (L) Representative pictures showing CD68 immunostaining in ipsilateral L4-L6 DRG 3, 7, and 14 days after model establishment. 4′,6-Diamidino-2-phenylindole (DAPI) was used as counterstain. Scale bar, 50 μm. (M) Summary of the number of CD68+ cells/mm2 as in (L). n = 5 to 6 rats per group. 7D, 7 days. (N) Representative pictures showing CD68 immunostaining in ipsilateral sciatic nerve. Scale bar, 100 μm. (O) Summary of the number of CD68+ cells/mm2 as calculated in (N). n = 6 rats per group. *P < 0.05 and **P < 0.01 versus sham group. NS, no significance. Two-way analysis of variance (ANOVA) followed by Tukey’s post hoc test for [(B) and (C)]. One-way ANOVA followed by Tukey’s post hoc test for (M). Student’s unpaired t test for [(K) and (O)].
Fig. 2.
Fig. 2.. Reg3β expression is specifically increased in rat DRG neurons upon CPIP model establishment.
(A) GO reanalysis of our former published dataset (#GSE158560) about up-regulated DEGs in ipsilateral L4-L6 DRG of CPIP model rats versus sham rats by RNA-seq. cAMP, cyclic adenosine 3′,5′5cyclic adenos. (B) Heatmap illustrating the top five up-regulated genes involved in inflammatory response as shown in (A). (C) qPCR validation of Reg3a and Reg3b gene expression. n = 5 rats per group. **P < 0.01. (D and E) Western blotting examination of Reg3β expression in ipsilateral L4-L6 DRG of sham (D) and CPIP model rats (E) from days 0 to 21. The top shows representative gel. The bottom shows summarized data. n = 6 rats per group. *P < 0.05 and **P < 0.01 versus day 0. (F) Reg3β immunostaining (green) in ipsilateral DRG of sham and CPIP model rats. DRG neurons were labeled with NeuN (red). Scale bar, 100 μm. (G) Summary of normalized fluorescence intensity of Reg3β immunostaining as in (F). n = 5 rats per group. *P < 0.05 and **P < 0.01 versus sham group. (H) Cell size distribution analysis of Reg3β+ DRG neurons derived from the sham and CPIP model group. (I) Double immunostaining of Reg3β (green) with satellite glial cell marker GS (red) in DRG of CPIP model rats. (J) Reg3b expression level in DRG of CPIP model rats detected by scRNA-seq. (K) Summary of Reg3b gene expression levels across different populations of cells in DRG of CPIP model rats examined by scRNA-seq. One-way ANOVA followed by Tukey’s post hoc test for [(D), (E), and (G)]. Two-way ANOVA followed by Tukey’s post hoc test for (C).
Fig. 3.
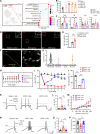
Fig. 3.. Reg3β contributes to macrophage infiltration in DRG and mechanical allodynia of CPIP model rats.
(A) Time schedule. (B) CD68 immunostaining in ipsilateral L4-L6 DRG of sham + IgG, CPIP + IgG, and CPIP + Reg3β-neutralizing Ab groups. Scale bar, 50 μm. (C) Summary of the number of CD68+ cells/mm2 from three groups as in (B). n = 7 rats per group. (D) 50% PWT changes in three groups. n = 8 to 10 rats per group. *P < 0.05 and **P < 0.01 versus sham + IgG group. ##P < 0.01 versus CPIP + IgG group. (E) Strategy for Reg3b-specific knockdown in DRG neurons using AAV-PHP.S with neuronal promoter hSyn. (F) EGFP detected in DRG of control (without viral injection), scramble-transfected, and Reg3b shRNA-transfected groups. Scale bar, 100 μm. (G) Summary of the percentage of EGFP+NeuN+ cells in DRG of three groups as in (F). n = 6 rats per group. (H) Western blotting showing Reg3β expression in DRG of CPIP + scramble versus CPIP + Reg3b shRNA group. n = 5 rats per group. (I) CD68+ immunostaining in DRG of sham + scramble, CPIP + scramble, and CPIP + Reg3b shRNA groups. Scale bar, 50 μm. (J) Summary of the number of CD68+ cells in DRG of three groups of rats as in (I). n = 5 rats per group. (K) 50% PWT changes in sham + scramble, CPIP + scramble, and CPIP + Reg3b shRNA groups. n = 5 to 6 rats per group. **P < 0.01 versus sham + scramble group. #P < 0.05 versus CPIP + scramble group. (L) Area under the curve (AUC) analysis of the curves shown in (K). n = 5 to 6 rats per group. (M) C-Fos immunostaining in ipsilateral SCDH of three groups. C-Fos was magnified and shown in the upper right, and its outline was illustrated in lower right. Scale bar, 50 μm. (N) Summary of the number of c-Fos+ cells in ipsilateral SCDH per observation field as shown in (M). n = 5 to 6 rats per group. *P < 0.05 and **P < 0.01. One-way ANOVA followed by Tukey’s post hoc test for [(C), (G), (J), (L), and (N)]. Student’s unpaired t test for (H). Two-way ANOVA followed by Tukey’s post hoc test for [(D) and (K)]. w, weeks; d, days.
Fig. 4.
Fig. 4.. Targeted overexpression of Reg3β in DRG neurons induces macrophage infiltration and produces mechanical allodynia in naïve rats.
(A) Strategy for Reg3b-specific overexpression in naïve rat DRG neurons using AAV-PHP.S with neuronal promoter hSyn. i.pl, intraplantar. (B) Time points for experiments in this study. (C) EGFP detected in ipsilateral DRG of control (nontransfected) and AAV-PHP.S-hSyn-EGFP (AAV-EGFP)–transfected rats. Scale bar, 100 μm. (D) Summary of the percentage of EGFP+NeuN+ cells in DRG as shown in (C). n = 5 rats per group. (E) Western blotting examining Reg3β expression in DRG of AAV-EGFP versus AAV-PHP.S-hSyn-Reg3b-EGFP (AAV-Reg3b-EGFP) groups of rats. n = 6 rats per group. (F) EGFP signals in ipsilateral/contralateral SCDH of control and AAV-EGFP–transfected naïve rats. Scale bar, 100 μm. (G and H) Summary of the normalized fluorescence intensity of EGFP in ipsilateral/contralateral SCDH of control and AAV-EGFP–transfected naïve rats as shown in (F). n = 5 to 6 rats per group. (I) 50% PWT changes in the injected hind paw (ipsilateral hind paw) of naïve rats transfected with AAV-EGFP or AAV-Reg3b-EGFP. n = 5 rats per group **P < 0.01 versus AAV-EGFP group. (J) Immunostaining of CD68+ cells (in red) in ipsilateral DRG of rats receiving AAV-EGFP or AAV-Reg3b-EGFP transfection. DAPI is in purple. Scale bar, 50 μm. (K) Summary of the number of CD68+ cells/mm2 in DRG of two groups of rats as shown in (J). n = 5 to 6 rats per group. **P < 0.01. Student’s unpaired t test for [(D), (E), (G), (H), and (K)]. Two-way ANOVA followed by Tukey’s post hoc test for (I).
Fig. 5.
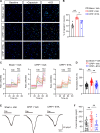
Fig. 5.. Infiltrated macrophages produce TNF-α that results in hyperexcitability in nociceptive sensory neurons and contributes to mechanical allodynia of CPIP model rats.
(A) KEGG analysis of signaling pathways activated in macrophages in DRG of CPIP rats. (B) Tnfa expression by qPCR in DRG. n = 5 rats per group. (C) Tnfa, Il6, Il1b, and Cxcl1 expression in DRG of sham, CPIP + Lipo, and CPIP + Clodro groups. n = 4 to 5 rats per group. (D) Tnfa (red) expression in ipsilateral DRG by RNAscope. DAPI was in white. Negative control probe against bacterial gene Dapb shows no staining. (E) Summary of Tnfa+ signals in DRG as in (D). n = 5 rats per group. (F) Colocalization of Cd68 (green) with Tnfa (red) in DRG of CPIP rats by RNAscope. (G) Summary of Tnfa expression in certain types of cells in DRG of CPIP rats by scRNA-seq. NK, natural killer. (H) Schedule. (I) 50% PWT in ipsilateral hind paws of sham + Veh, CPIP + Veh, and CPIP + ETA groups. **P < 0.01 versus sham group. ##P < 0.01 versus CPIP + Veh group. (J) Normalized AUC analysis of curves in (I). n = 6 rats per group. (K) APs in small-sized DRG neurons of three groups. Five hundred–picoampere depolarizing current (1000 ms) was used to stimulate APs firing. (L) Number of APs elicited by 500-pA depolarizing current as in (K). n = 23 to 25 cells per group. (M) Summary of the number of APs triggered by depolarizing current steps in DRG neurons. n = 23 to 25 cells per group. *P < 0.05 and **P < 0.01 versus sham + Veh group. #P < 0.05 and ##P < 0.01 versus CPIP + Veh group. (N) APs elicited by ramp current. (O) Summary of the number of APs triggered by ramp current. n = 23 to 27 cells per group. (P) Summary of current threshold for eliciting APs by ramp current. n = 23 to 27 cells per group. One-way ANOVA followed by Tukey’s post hoc test for [(B), (C), (E), (J), (L), (O), and (P)]. Two-way ANOVA followed by Tukey’s post hoc test for [(I) and (M)].
Fig. 6.
Fig. 6.. TNF-α enhances TRPV1 channel activity in DRG neurons of CPIP model rats.
(A) Representative images from Fura-2–based ratiometric Ca2+ imaging showing Ca2+ transients in DRG neurons when challenged with TRPV1-specific agonist capsaicin (Cap, 300 nM) in sham + Veh, CPIP + Veh, and CPIP + ETA groups. KCl (40 mM) was applied at the end to activate all living DRG neurons. (B) Summary of the percentage of capsaicin responsive DRG neurons in each observation field from three groups. n = 6 tests per group. (C) Overlaid Ca2+ transients of DRG neurons from three groups. Thirty neurons were included in each group. Capsaicin and KCl were applied as shown. (D) Summary of normalized AUC of Ca2+ traces responding to capsaicin of three groups as shown in (C). n = 113, 120, and 109 cells per group. (E) Representative inward current traces elicited by capsaicin (300 nM) perfusion in DRG neurons from three groups recorded by whole-cell patch clamp. DRG neurons were continuously held at −60 mV under voltage clamp mode. The dashed line indicated zero current level. (F) Summary of current density [picoamperes per picofarad (pA/pF)] elicited by capsaicin in three groups as shown in (E). Twenty, 23, and 18 neurons were included for sham + Veh, CPIP + Veh, and CPIP + ETA groups, respectively. *P < 0.05 and **P < 0.01. One-way ANOVA followed by Tukey’s post hoc test for [(B), (D), and (F)].
Fig. 7.
Fig. 7.. Identification of Reg3β as the downstream signaling triggered by TNF-α in DRG neurons of CPIP model rats.
(A) Schedule for experiments. (B) Flow chart of RNA-seq of DRG. Created in BioRender. Pan, Y. (2025) https://BioRender.com/8d0kcrp. (C and D) Volcano graph indicating DEGs identified from ipsilateral L4-L6 DRG by comparing CPIP + Veh versus sham + Veh or CPIP + ETA versus CPIP + Veh groups. (E) DEGs from (C) and (D) were displayed by heatmap illustration. n = 2 rats per group. (F) Scatterplot illustrating DEGs overlapped between groups of CPIP + Veh versus sham + Veh and CPIP + ETA versus CPIP + Veh. (G) GO analysis of DEGs as outlined by the dotted box shown in (F). (H) The list of top three mostly up-regulated DEGs deduced from inflammatory response as indicated in (G). (I) Representative immunostaining pictures showing Reg3β expression (in red) in ipsilateral L4-L6 DRG from sham + Veh, CPIP + Veh, and CPIP + ETA groups of rats. Neuronal marker NeuN is shown in green. Scale bar, 100 μm. (J) Summary of normalized fluorescence intensity of Reg3β staining in DRG of three groups of rats. n = 5 to 6 rats per group. *P < 0.05 and **P < 0.01. One-way ANOVA followed by Tukey’s post hoc test for (J).
Fig. 8.
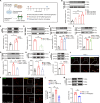
Fig. 8.. TNF-α promotes Reg3β overexpression and secretion in DRG neurons.
(A) Experiment workflow. Created in BioRender. Pan, Y. (2025) https://BioRender.com/q78vdpp. (B) Reg3β secretion in culture medium under TNF-α treatment. Top: Bands of Reg3β and β-actin in culture medium and β-actin in DRG cell lysates. β-Actin in culture medium was examined as negative control. Bottom: Quantification of Reg3β secretion by TNF-α and Veh (0.1% BSA) in culture medium. n = 3 cultures per group. (C) Reg3β expression in DRG cell lysates. n = 4 cultures per group. (D to G) Impacts of different pharmacological treatments on Reg3β secretion in culture medium triggered by TNF-α. TNFR1 Ab (5 μg/ml) was used to neutralize TNFR1; PDTC (10 μM): NF-κB inhibitor; Adz (10 μM): p38 MAPK inhibitor; S3I-201 (100 μM): STAT3 inhibitor. n = 3 cultures per group. (H) Effects of STAT3 inhibitor on Reg3β overexpression in DRG cell lysates by TNF-α. n = 5 to 6 cultures per group. (I) p-STAT3 and STAT3 expression in DRG cell lysates. n = 3 cultures per group. (J) Overlapping of Reg3β+ cells (green) and neurons (stained with Nissl, red) in DRG cell culture after TNF-α treatment by ICC. Scale bar, 50 μm. White arrowheads indicate overlapped cells. (K) ICC showing p-Syk expression (green) in DRG cell cultures of BSA + IgG, TNF-α + IgG, and TNF-α + TNFR1 Ab groups. Scale bar, 100 μm. (L) Summary of % of p-Syk+ cells among Nissl+ cells of each group as in (K). n = 6 cultures per group. (M) p-STAT3 and STAT3 expression after TNF-α treatment in DRG lysates pretreated with either Veh [0.1% dimethyl sulfoxide (DMSO)] or PRT062607 (Syk inhibitor, 50 nM). n = 6 cultures per group. One-way ANOVA followed by Tukey’s post hoc test for [(B), (E) to (H), and (L)]. Student’s unpaired t test for [(C), (D), (I), and (M)]. *P < 0.05 and **P < 0.01.
Fig. 9.
Fig. 9.. TNF-α/Syk/STAT3–mediated signaling contributes to Reg3β overexpression in DRG neurons that results in macrophage infiltration and chronic pain in CPIP model rats.
(A) Experiments schedule. (B) p-STAT3 and STAT3 expression in ipsilateral L4-L6 DRG of sham and CPIP model rats. n = 5 rats per group. (C) p-STAT3 immunostaining (green) in DRG of sham + Veh, CPIP + Veh, and CPIP + ETA groups. Neurons were stained with Nissl (red). (D) Normalized fluorescence intensity of p-STAT3 immunostaining in DRG of three groups as in (C). n = 5 rats per group. (E) p-STAT3 and STAT3 expression in ipsilateral L4-L6 DRG of three groups. n = 6 rats per group. (F) Overlapping of p-STAT3+ cells (green) with p-Syk+ cells (red) and neurons (by Nissl, purple) in DRG of CPIP model rats. White arrows indicate overlapped cells. (G) Reg3β immunostaining (in red) in DRG of sham + Veh, CPIP + Veh, and CPIP + S3I-201 groups. (H) Normalized fluorescence intensity of Reg3β in DRG of three groups as in (G). n = 6 to 7 rats per group. (I) Immunostaining showing overlapping of p-STAT3+ cells (green) with Reg3β+ cells (red) in DRG of CPIP model rats. Purple: DAPI. White arrows indicate overlapped cells. (J) CD68 immunostaining (red) in DRG of sham + Veh, CPIP + Veh, and CPIP + S3I-201 groups. DAPI in purple. (K) The number of CD68+ cells in DRG of three groups as in (J). n = 6 rats per group. *P < 0.05 and **P < 0.01. (L) 50% PWT changes in three groups. n = 6 rats per group.**P < 0.01 versus sham + Veh group. ##P < 0.01 versus CPIP + Veh group. Scale bar is as indicated. One-way ANOVA followed by Tukey’s post hoc test for [(D), (E), (H), and (K)]. Two-way ANOVA followed by Tukey’s post hoc test for (L). Student’s unpaired t test for (B).
Fig. 10.
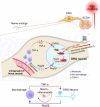
Fig. 10.. Neuronal Reg3β/macrophage TNF-α–mediated positive feedback signaling in DRG of a rat model of CRPS-I that contributes to persistent neuroinflammation and pain chronicity.
When an initial pain occurs, DRG neurons release Reg3β in response to the insult. Reg3β produces a chemotactic effect on CCR2+ monocytes/macrophages from intraganglionic blood vessels. Infiltrated macrophages polarize to M1 phenotype and release proinflammatory cytokine TNF-α. TNF-α activates TNFR1 expressed on DRG neurons and promotes the expression/activity of TRPV1 channel, resulting in hyperexcitability of nociceptive neurons. On the other hand, TNF-α promotes Reg3β overexpression via TNFR1/Syk/STAT3-mediated intracellular signaling in DRG neurons. The overexpressed Reg3β is then released into extracellular space as a chemoattractant to attract more monocytes/macrophages from intraganglionic blood vessels. This work reveals a positive feedback signaling conveyed by neuronal Reg3β and macrophage TNF-α that contributes to persistent neuroinflammation in local DRG, resulting in nociceptive neuron hyperexcitability and pain chronicity in a rat model of CRPS-I. Image is created in BioRender. Pan, Y. (2025) https://BioRender.com/rpn9bdm.

References

    1. Ott S., Maihöfner C., Signs and symptoms in 1,043 patients with complex regional pain syndrome. J. Pain 19, 599–611 (2018). - PubMed
    1. Birklein F., Ajit S. K., Goebel A., Perez R. S. G. M., Sommer C., Complex regional pain syndrome — phenotypic characteristics and potential biomarkers. Nat. Rev. Neurol. 14, 272–284 (2018). - PMC - PubMed
    1. Marinus J., Moseley G. L., Birklein F., Baron R., Maihöfner C., Kingery W. S., van Hilten J. J., Clinical features and pathophysiology of complex regional pain syndrome. Lancet Neurol. 10, 637–648 (2011). - PMC - PubMed
    1. Taylor S. S., Noor N., Urits I., Paladini A., Sadhu M. S., Gibb C., Carlson T., Myrcik D., Varrassi G., Viswanath O., Complex regional pain syndrome: A comprehensive review. Pain Ther. 10, 875–892 (2021). - PMC - PubMed
    1. Fassio A., Mantovani A., Gatti D., Rossini M., Viapiana O., Gavioli I., Benini C., Adami G., Pharmacological treatment in adult patients with CRPS-I: A systematic review and meta-analysis of randomized controlled trials. Rheumatology 61, 3534–3546 (2022). - PubMed

Substances