. 2025 Aug 1;20(8):e0328906.
doi: 10.1371/journal.pone.0328906. eCollection 2025.

Machine learning combining external validation to explore the immunopathogenesis of diabetic foot ulcer and predict therapeutic drugs

Affiliations

Machine learning combining external validation to explore the immunopathogenesis of diabetic foot ulcer and predict therapeutic drugs

Zhongwen Lu et al. PLoS One. .

Abstract

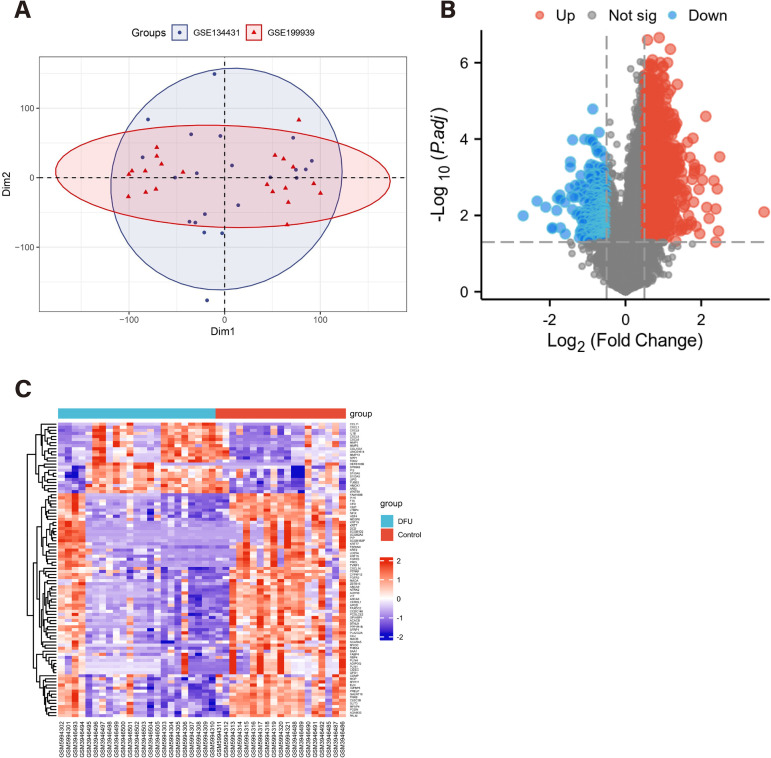
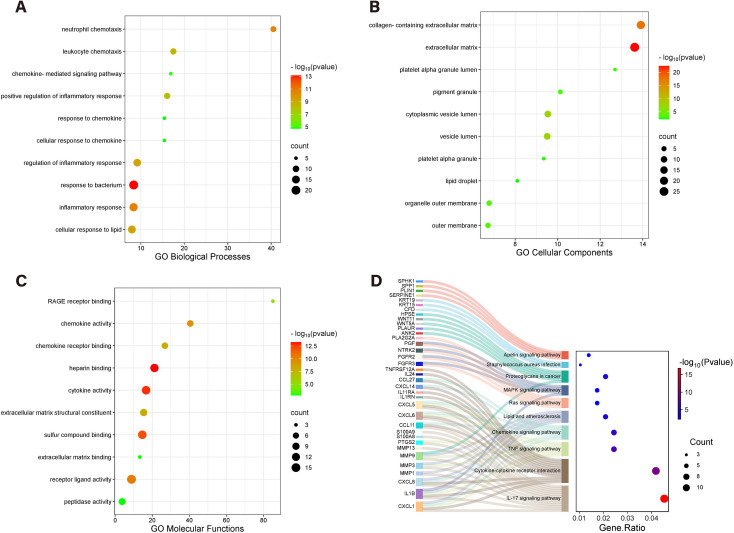
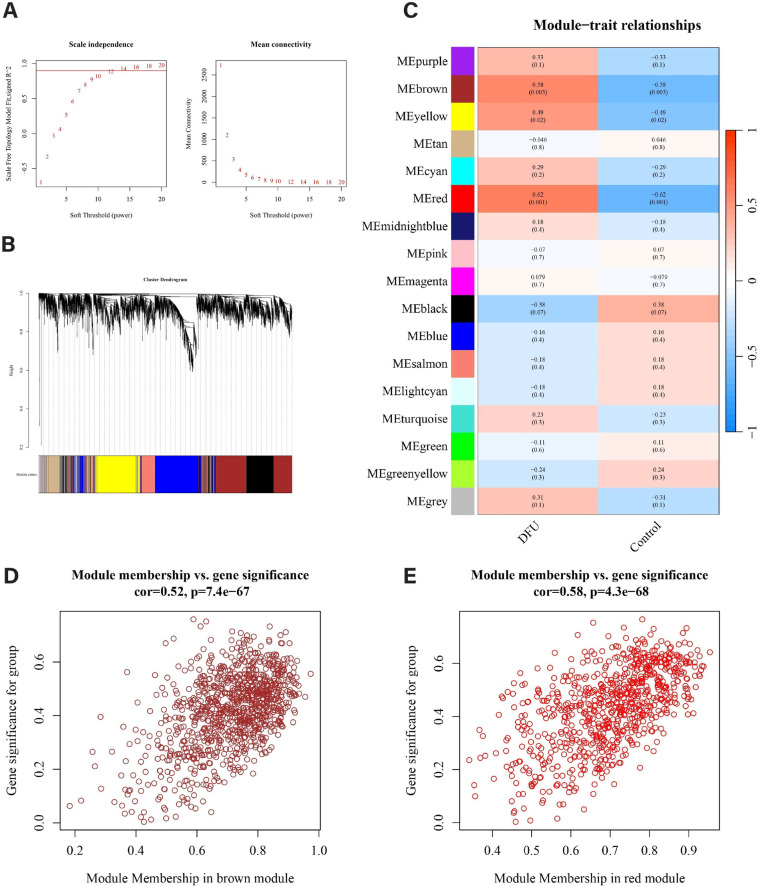
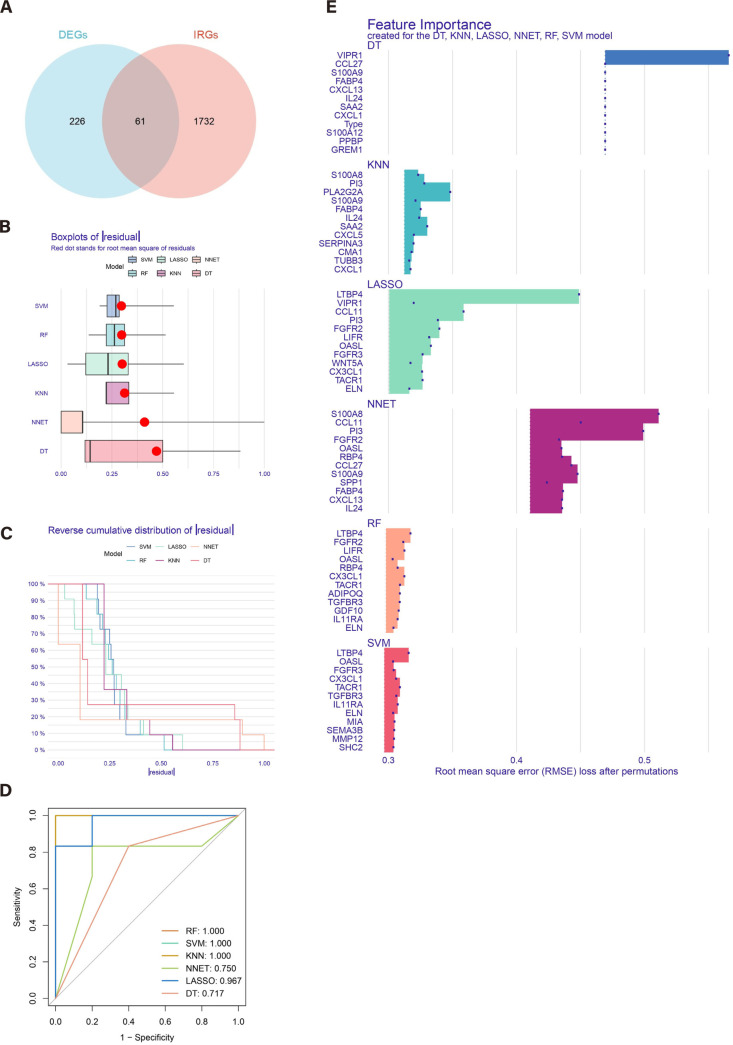
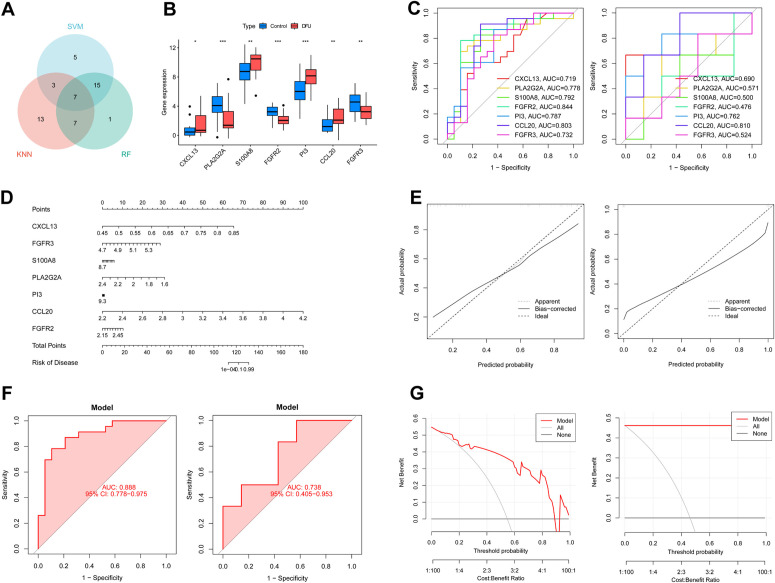
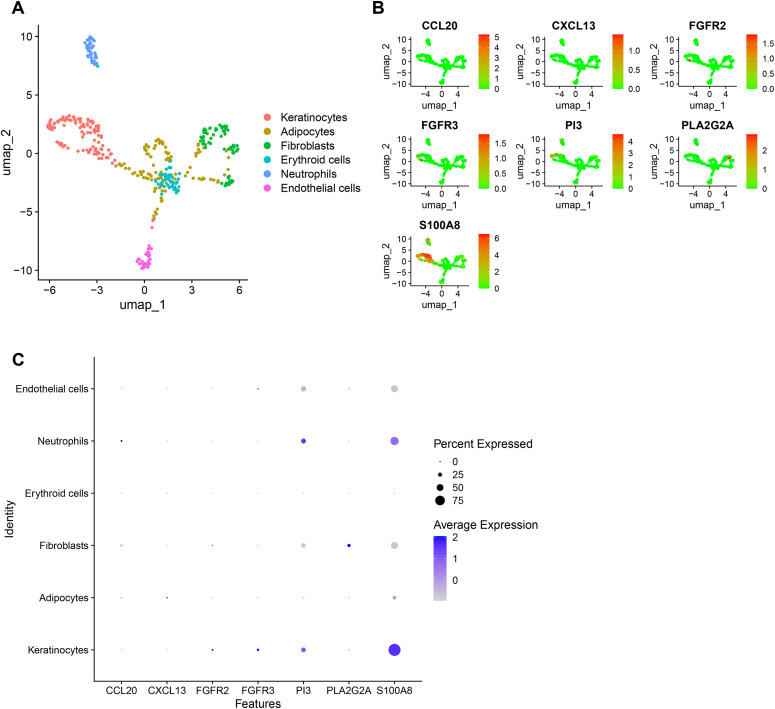
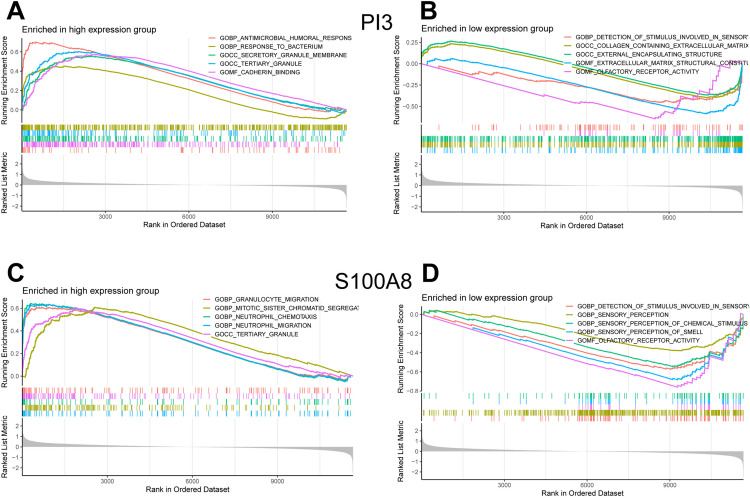
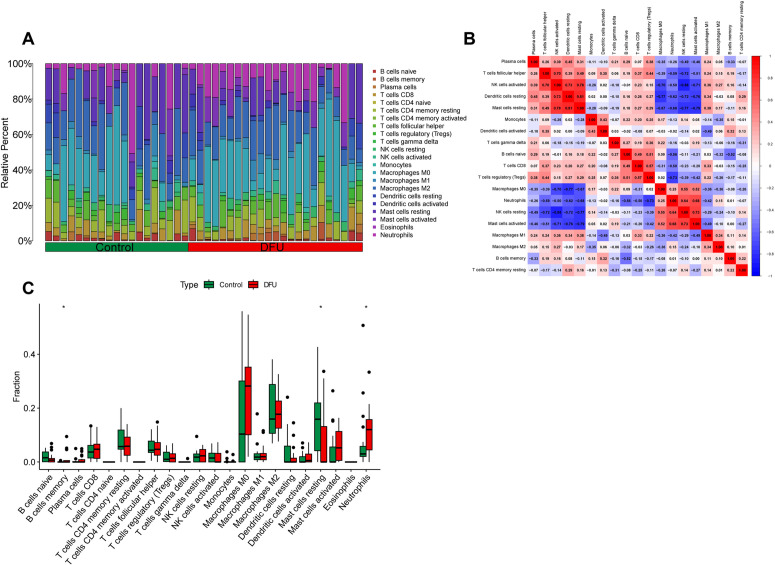
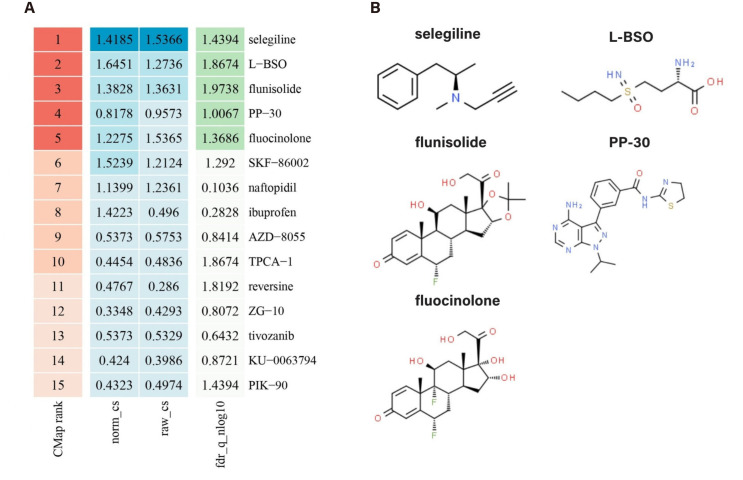
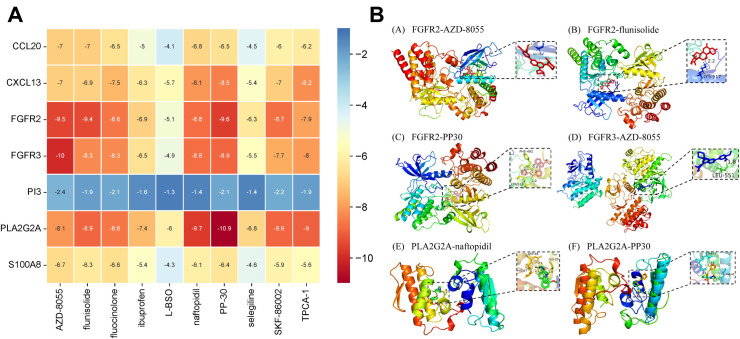
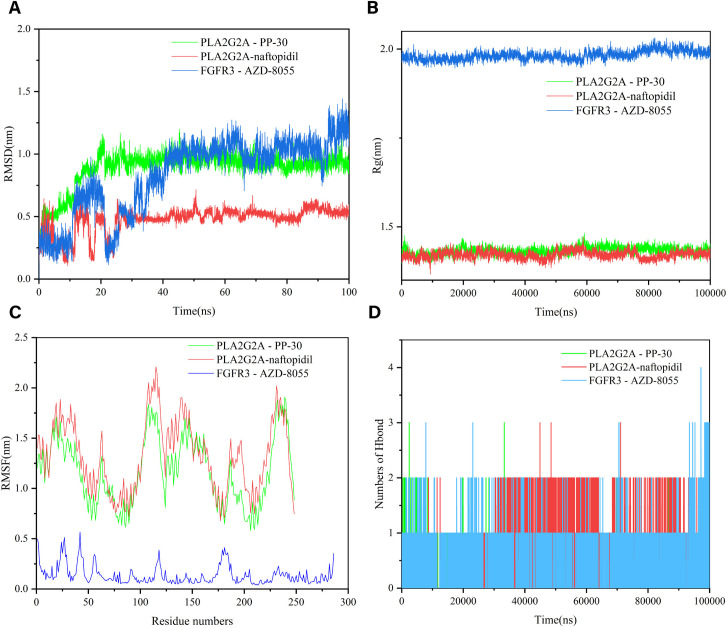
Diabetic foot ulcer (DFU) is a severe complication of diabetes, often leading to amputation due to poor wound healing and infection. The immune-related pathogenesis of DFU remains unclear, and therapeutic drugs are limited. This study aimed to explore the immune mechanisms of DFU and identify potential therapeutic drugs using machine learning and single-cell approaches. Through differential expression analysis of Gene Expression Omnibus (GEO) datasets, we identified 287 differentially expressed genes (DEGs), which were significantly enriched in IL-17 signaling and neutrophil chemotaxis pathways. Weighted gene co-expression network analysis (WGCNA) further pinpointed disease-associated modules containing 1,693 regulatory genes. Machine learning algorithms prioritized seven core genes-CCL20, CXCL13, FGFR2, FGFR3, PI3, PLA2G2A, and S100A8-with validation in an external dataset GSE147890 and single-cell sequencing revealing their predominant expression in neutrophils and keratinocytes. Immune infiltration analysis demonstrated significant dysregulation in DFU patients, characterized by elevated proportions of memory B cells, M0 macrophages, activated mast cells, and neutrophils. Potential therapeutic compounds were identified using the Connectivity Map database and tested through molecular docking and dynamics simulations. The study pinpointed selegiline, L-BSO, flunisolide, PP-30, and fluocinolone as promising therapeutic agents, offering new insights into the pathogenesis of diabetic foot ulcers (DFU) and potential therapeutic strategies.


Conflict of interest statement

The authors declare no competing interests.

Figures

Fig 1
Fig 1. Flow chart of this study.
Fig 2
Fig 2. Screening differentially expressed genes (DEGs) and senescence related DEGs in diabetic foot ulcer (DFU).
(A)The principal component analysis (PCA) displaying a distinct profile between GSE134431 and GSE199939. (B) The volcano plot showing upregulated (Red) and downregulated (Blue) DEGs. (C) Clustering analysis and heatmap of the DEGs between DFU and control groups.
Fig 3
Fig 3. GO and KEGG Enrichment Analysis of DFU.
(A-C) The bubble plots of the GO enrichment of DEGs, including biological process, cellular component, and molecular function. (D) The Sankey diagram showing the KEGG enrichment analysis of DEGs.
Fig 4
Fig 4. Identification of gene modules associated with DFU using WGCNA.
(A) The selection of optimal soft thresholding power. (B) Gene dendrogram and modules. Gene modules associated with DFU were shown in different colors under the gene dendrogram. (C) The correlation heatmap representing the relationship between different gene modules and status of DFU. (D-E) Scatter plots showing the correlation between module membership (MM) and gene significance (GS) in the red and brown modules. WGCNA, weighted gene co-expression network analysis.
Fig 5
Fig 5. Construction of RF, SVM, KNN, NNET, LASSO and DT machine models.
(A) Intersection of the differentially expressed genes and immune-related genes. (B) The cumulative residual distribution of the six models. (C) Residual Boxplots of the six machine learning models, where the red dots indicate the root mean square of the residuals. (D) ROC analysis of six machine learning models with fivefold cross-validation in the test set. (E) The important features in RF, SVM, KNN, NNET, LASSO and DT.
Fig 6
Fig 6. Validation analysis of machine learning of seven feature genes.
(A) Intersection of the three machine learning outcomes. (B) Gene expression boxplots for 7 feature genes. (C) ROC curve of 7 feature genes (The left is the training set and the right is the test set). (D) The diagnostic nomogram based on 7 feature genes. (E) Calibration curve to evaluate the accuracy of the nomogram(The left is the training set and the right is the test set). (F)ROC of the validation Gene Expression Omnibus (GEO) data set(The left is the training set and the right is the test set).(G) Decision curve of feature genes nomogram (The left is the training set and the right is the test set).
Fig 7
Fig 7. Expression profiles of hub genes in single cells.
(A) Cellular subtypes of Diabetic foot ulcer. (B), (C) Scatter plots and bubble plot of the expression of the 7 hub genes.
Fig 8
Fig 8. Single gene GSEA of characteristic genes.
GO and KEGG enrichment analysis using GSEA for the gene PI3 and S100A8, including enriched in high expression group and low expression group.
Fig 9
Fig 9. Immune cell infiltration analysis.
(A) The stacked bar plot representing the different immune cell proportions in each sample. (B) The heatmap showing the correlation between different immune cells. Red represented a positive correlation, while blue represented a negative correlation. (C) The boxplot depicting the comparison of 22 types of immune cells between DCM and control groups.
Fig 10
Fig 10. The ranking of drugs in the CMap database and the drug molecular structure.
(A) Ranking and scoring of drugs in the CMap database. (B) The molecular structure of drugs.
Fig 11
Fig 11. Results of molecular docking.
(A) Binding energy results of molecular docking. (B) Presentation of molecular docking results.
Fig 12
Fig 12. The molecular dynamics (MD) simulation of the PLA2G2A and naftopidil complex, PLA2G2A and PP-30 complex and FGFR3 and AZD-8055 complex.
(A) The RMSD plot of the PLA2G2A and naftopidil complex, PLA2G2A and PP-30 complex and FGFR3 and AZD-8055 complex. (B) The Rg plot of the PLA2G2A and naftopidil complex, PLA2G2A and PP-30 complex and FGFR3 and AZD-8055 complex. (C) The RMSF plot of the PLA2G2A and naftopidil complex, PLA2G2A and PP-30 complex and FGFR3 and AZD-8055 complex. (D) The number of hydrogen bonds in the PLA2G2A and naftopidil complex, PLA2G2A and PP-30 complex and FGFR3 and AZD-8055 complex.

Similar articles

References

    1. Zhang P, Lu J, Jing Y, Tang S, Zhu D, Bi Y. Global epidemiology of diabetic foot ulceration: a systematic review and meta-analysis †. Ann Med. 2017;49(2):106–16. doi: 10.1080/07853890.2016.1231932 - DOI - PubMed
    1. Mavrogenis AF, Megaloikonomos PD, Antoniadou T, Igoumenou VG, Panagopoulos GN, Dimopoulos L, et al. Current concepts for the evaluation and management of diabetic foot ulcers. EFORT Open Rev. 2018;3(9):513–25. doi: 10.1302/2058-5241.3.180010 - DOI - PMC - PubMed
    1. Dutra LMA, Melo MC, Moura MC, Leme LAP, De Carvalho MR, Mascarenhas AN, et al. Prognosis of the outcome of severe diabetic foot ulcers with multidisciplinary care. J Multidiscip Healthc. 2019;12:349–59. doi: 10.2147/JMDH.S194969 - DOI - PMC - PubMed
    1. Margolis DJ, Malay DS, Hoffstad OJ, Leonard CE, MaCurdy T, De Nava KL, et al. Incidence of diabetic foot ulcer and lower extremity amputation among medicare beneficiaries, 2006 to 2008: Data points# 2. Data points. 2011;2:4. - PubMed
    1. Forde H, Wrigley S, O’Murchadha LT, Cusack L, Casserly S, Moneley D. Five-year outcomes of patients attending a diabetic foot clinic in a tertiary referral centre. Irish Journal of Medical Science (1971-). 2020;189:511–5. - PubMed