. 2025 Aug 12;58(8):2035-2053.e9.
doi: 10.1016/j.immuni.2025.07.008. Epub 2025 Jul 31.

Mutations in MLL3 promote breast cancer progression via HIF1α-dependent intratumoral recruitment and differentiation of regulatory T cells

Affiliations

Mutations in MLL3 promote breast cancer progression via HIF1α-dependent intratumoral recruitment and differentiation of regulatory T cells

Marie Boutet et al. Immunity. .

Abstract

Loss-of-function mutations in MLL3, encoding the histone methyltransferase MLL3/KMT2C, are frequent in various cancer types. To examine the mechanisms whereby MLL3 suppresses tumorigenesis, we developed a mouse mammary-stem-cell-based tumor model bearing cancer-driver mutations, including loss of MLL3/KMT2C and p53 and constitutive phosphatidylinositol 3-kinase (PI3K) activation, recapitulating a genetic makeup of aggressive human breast cancers. MLL3 loss stabilized the transcription factor HIF1α, which increased secretion of the chemokine CCL2 by tumor cells and promoted recruitment of CCR2+ regulatory T (Treg) cells. Treg cell depletion slowed tumor onset and progression. In human breast tumors, infiltration of Treg cells correlated with the presence of MLL3 mutations. HIF1α enforced BLIMP-1-dependent differentiation of tumor-infiltrating Treg cells into ICOShiGITRhi effectors that secreted the immunosuppressive cytokines transforming growth factor β (TGF-β) and interleukin-10 (IL-10). Antibody targeting of ICOS or GITR depleted tumor Treg cells and inhibited tumorigenesis. Thus, MLL3 mutations shape an immunosuppressive tumor immune microenvironment in aggressive breast cancers and likely in other cancers where functional MLL3 is lost.

Keywords: CCL2; CCR2(+) Treg cells; CRISPR; HIF1a; ICOS and GITR; IL-10; KMT2C-MLL3/p53/PI3 kinase tumor driver mutations; TGF-β; effector BLIMP-1(+) ICOS(high)/GITR(high) Foxp3(+) regulatory T cells in tumors; immune checkpoint blockade therapy; preclinical murine mammary-stem-cell-based breast tumor.


Conflict of interest statement

Declaration of interests The authors declare no competing interests.

Figures

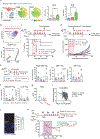
Figure 1.
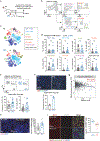
Figure 1.. Loss of MLL3 cooperates with PIK3CA and p53 mutations to drive tumor onset and growth.
(A) Common mutations occurring with MLL3 (left) and both MLL3/PIK3CA mutations (right) in MSKCC-IMPACT 2017 Breast Cancer database. (B) Overall survival of patients with the indicated mutations in the TCGA Breast dataset. (C) Generation of Pik3ca-mutant/p53−/− (P5) and Pik3ca-mutant/p53−/−/Mll3−/− (MP5) mouse MaSC organoids. (D) Western blot validation of MaSC organoids. Some MLL3 bands were degraded MLL3 proteins. (E) Experimental schematic. (F) Tumor onset (left) and growth (right). Top: P5 (n=10) versus MP5 (n=10) expressing Pik3caH1047R (line#1, representative of 3 repeats); bottom: P5 (n=12) versus MP5 (n=8) expressing Pik3ca* (line#7, representative of 2 repeats). (G) Immunofluorescence (IF) images and quantification of Ki67 in P5 (n=4) and MP5 pre-onset tumors (n=7) from line#3. (H) IF images and quantification of Ki67 expression in established P5 (n=7) and MP5 tumors (n=8) (lines #1 and #3). Data are presented as mean ± SEM. P-values were determined by Log-rank test (B and F) or unpaired t-test (G and H). *p<0.05, **p< 0.01, ***P<0.001, ****p< 0.0001 in all figures.
Figure 2.
Figure 2.. Loss of MLL3 promotes Treg cell infiltration during tumor initiation and correlates with higher Treg cell frequency in patients.
(A) Experimental schematic (MaSC line#3). (B) Flow cytometry gating strategy. (C) T-SNE overlays of immune cell subsets. (D) Numbers of immune cell subsets in each tumor. (E) Frequency (within CD4+ T cells) and numbers of Foxp3+CD4+ Treg cells with representative flow cytometry plots. Data (D, E) are from 4 independent experiments (P5, n=19 and MP5, n=22). (F) IF images and quantification of CD4+Foxp3+ Treg cells in P5 and MP5 pre-onset tumors (n=4/group). (G) Correlation between MLL3 expression and Treg infiltration in the TCGA Breast cohort by TIMER2.0 analysis (n=1100). (H) IF images and quantification of FOXP3+ Treg cells in MLL3-WT or -mutant human breast cancer patient samples (n=11). Values are average of 3–5 random fields in each sample normalized to the total DAPI+ area. (I) IF images and quantification of Foxp3+ Treg cells in MLL3-high or -low breast cancer (n=8 patients/group; top and bottom 10%, respectively). Data are mean±SEM. P-values were determined by unpaired t-test (D, E, F, G, H, and I) or Spearman’s correlation test (G).
Figure 3.
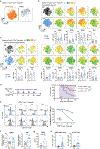
Figure 3.. Immunosuppressive Treg cells contribute to faster initiation of Mll3-mutant tumors.
(A-C) Overlays of t-SNE spatial distribution of Treg cells based on 25-marker flow cytometry analysis (A) in the dLN versus pre-onset tumors. Mice transplanted with P5 and MP5 MaSCs were combined (dLN: n=18, tumor: n=35). (B, C) T-SNE spatial distribution of Treg cells infiltrating P5 or MP5 pre-onset tumors with relative expression level of indicated markers per cell. Bar graphs average Treg-cell expression level for each marker. Each symbol on bars features 1 tumor. T-SNE maps concatenate data from (B) 5 independent experiments (P5: n=27, MP5: n=37 tumors), and (C) 4 independent experiments (P5: n=18 tumors, MP5: n=21 tumors). (D) Tumor onset of P5 or MP5 MaSCs (line#2) in Foxp3DTR mice treated with diphtheria toxin (DT) or control PBS (n=32 tumors pooled from two experiments). (E) T cell suppression assay by co-culturing sorted Treg cells from P5 or MP5 pre-onset tumors with CTV-labelled CD8+ T cells. CTV-low cells were defined as proliferative T cells. (F) Tgfb1 and Il10 mRNA level in P5 or MP5 pre-onset tumors (n=8). (G) TGFβ protein level in P5 or MP5 pre-onset tumors (n=4). (H) Number of TGFβ-LAP+ or IL-10+ Treg cells in P5 or MP5 pre-onset tumors (P5: n=9, MP5: n=16). Data are mean±SEM. P-values were determined by unpaired t-test (C, F, G and H) or Log-rank test (D).
Figure 4.
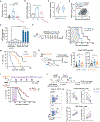
Figure 4.. HIF-1α stabilization in MLL3-mutant tumors controls early tumor onset and Treg cell infiltration.
(A) Expression of HIF1α targets in P5 and MP5 MaSCs (line#4). (B) Immunohistochemistry images and quantification of HIF1α protein in P5 (n=6) and MP5 pre-onset tumors (n=10) (line#1). (C) Gene Set Enrichment Analysis for Hypoxia signature in P5- (n=115) or MP5-like (n=77) tumors from TCGA Breast database. (D) HIF1α protein stability assay (summary of three independent lines #1, 2, 3). (E) HIF1α lysine methylation level. Samples were immunoprecipitated and immunoblotted with the indicated antibodies (one of three repeats shown). (F) Tumor onset of P5 control (P5-sgNT, n=12), MP5 control (MP5-sgNT, n=22) or MP5 HIF1α-deficient (MP5-sgHif1a, n=10) MaSCs transplanted to FVB mice (data from two experiments). (G) Images and mean volumes of MP5-sgNT (n=5) and MP5-sgHif1a (n=5) tumors collected 30 days post-transplantation. (H) Experimental schematic and representative plots showing CD4+ Tconv and Foxp3+ Treg cells in pre-onset tumors. Graphs summarize 3 replicate experiments (n=9 tumors). (I) CD4 and Foxp3 immunofluorescence images and frequency of Foxp3+ cells among CD4+ T cells in P5-sgNT (n=4), MP5-sgNT (n=5) and MP5-sgHif1α (n=3) pre-onset tumors. P-values were determined by unpaired t-test (A, B, G, H, and I) or nonlinear curve fitting (D) or Log-rank test (F). Data are mean±SEM.
Figure 5.
Figure 5.. HIF1α mediates increase of CCL2 in tumor cells which promotes Treg cell infiltration and early tumor onset.
(A) Concentration of CCL2 chemokine in pre-onset tumors. (B) Ccl2 mRNA expression in MaSCs (line#3). (C) CCL2 mRNA expression in MLL3-WT (n=769) and MLL3-mutant (n=315) tumors in TCGA Breast dataset. (D) Correlation of HIF1A and CCL2 expression in MLL3-mutant tumors of the same dataset. RSEM, RNA-seq by Expectation Maximization. (E) Relative enrichment of HIF1α occupancy around the Ccl2 transcription start site (TSS) in MP5 MaSCs (line#3, representative of three experiments). Gene-desert regions used as negative controls. (F) Onset curve for MP5 tumors treated with anti-CCL2 or control isotype mAbs (Pool of 2 experiments, n=10 tumors/group). (G) Tumor onset for P5-CCL2OE (n=14), P5-control vector (n=16) and MP5-control vector (n=8) MaSCs implanted in FVB mice (Pool of two experiments). (H) Frequency and number of Foxp3+CD4+ Treg cells in pre-onset tumors. (I) Tumor onset for P5-CCL2OE with or without Treg cell depletion (n=36 tumors, pooled from two experiments). (J) Experimental schematic. Frequency and numbers of Foxp3+CD4+ Treg and non-Treg CD4+ T cells in WT and Ccr2KO hematopoietic-derived (CD45+) compartment of pre-onset nodules. Representative dot plots and summary graphs from 2 experiments are shown (n=5). Data are mean±SEM. P-values were determined by unpaired t-test (A, B, C, E and H) or Pearson’s correlation (D) or Log-rank test (F, G and I) or paired t-test (J).
Figure 6.
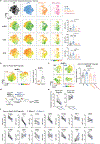
Figure 6.. HIF1α promotes BLIMP-1-dependent differentiation of effector Treg cells with a highly immunosuppressive phenotype in early-stage tumors.
(A) T-SNE spatial distribution of Treg cells infiltrating indicated pre-onset tumors based on flow cytometry (P5 and MP5 data that of Figure 3) and relative expression of indicated markers per cell on t-SNE maps, with bar graphs averaging level for each marker in Treg cells per tumor. T-SNE maps concatenate data from 5 independent experiments (P5: n=27, MP5: n=37, P5-CCL2OE: n=13, and MP5-sgHif1α: n= 11 tumors). (B) Heatmap for BLIMP-1 expression in tumor-infiltrating and dLN Treg cells overlayed on t-SNE of Treg cells by flow cytometry. Relative expression of BLIMP-1 (dLN: n=18, tumor: n=35). (C) Heatmap for BLIMP-1 expression in tumor-infiltrating Treg cells overlayed on t-SNE of Treg cells by flow cytometry. Relative expression of BLIMP-1 (P5: n=19, MP5: n=21, P5-CCL2OE: n=13, MP5-sgHif1α: n=11). (D) Experimental schematic. (E) Frequency of CD4+Foxp3+ Treg and CD4+Foxp3 Tconv cells within CD3+ cells (n=10 tumors). (F) Relative expression of indicated markers on Treg cells (n=10 tumors). Each symbol on bars features 1 tumor. Data are mean±SEM. P-values were determined by unpaired (A, B) or paired t-test (D, E).
Figure 7.
Figure 7.. Therapeutic targeting of ICOS or GITR prevents tumor onset and growth by depleting Treg cells.
(A) T-SNE overlays of indicated T cell populations on tumor-infiltrating immune cells (CD45+) and relative cell-surface expression of ICOS and GITR. Bar graphs average overall level for both markers. (B) Representative plot and levels of GITR and ICOS on TGFβ−LAP and IL-10 double-positive or -negative Treg cell populations in MP5 pre-onset tumors (line#1, n=16 tumors). (C) Experimental design and tumor onset in B6 mice implanted with MP5 MaSCs and treated with ICOS, GITR or control isotype mAbs. Data pool two replicate experiments (n=10 mice/group). (D) Experimental design and tumor growth in B6 mice implanted with MP5 MaSCs and treated with mAbs against ICOS (n=21), GITR (n=22), PD-1 (n=8) or control isotype (n=21). (E) Experimental design and numbers of Foxp3+CD4+ Treg, CD8+ T, and Foxp3CD4+ Tconv cells in the MP5 tumors (line#2) treated with the indicated mAbs (GITR: n=16, ICOS: n=16, PD-1: n=8, Isotype: n=22 tumors). (F) Numbers of TGFβ−LAP or IL-10-positive Treg cells (Foxp3+CD4+) in the MP5 tumors treated as in (E) (GITR: n=19, PD-1: n=18, Isotype: n=20 tumors). (G) Amount of TGFβ protein in the MP5 tumors treated as in (E) (n=12 tumors). (H) Experimental design and tumor onset of MP5 MaSCs implanted in WT or Foxp3DTR B6 mice and treated with GITR agonist or control isotype mAbs and DT (n=20 tumors/group). (I) Inverse correlation of MLL3 and GITR mRNA expression in TCGA Breast dataset (N=1082). (J) IF images and frequency of Foxp3+ cells in GITR+ cells on human breast cancer FFPE sections (n=15). Data are mean±SEM. P-values were determined by unpaired t-test (A, E, F) or paired t-test (B) or Log-rank test (C, H) or Two-way-ANOVA (D) or Mann–Whitney u-test (G) or Pearson’s rank correlation (I).

References

    1. O’Donnell JS, Teng MWL, and Smyth MJ (2019). Cancer immunoediting and resistance to T cell-based immunotherapy. Nat Rev Clin Oncol 16, 151–167. 10.1038/s41571-018-0142-8. - DOI - PubMed
    1. Dunn GP, Old LJ, and Schreiber RD (2004). The three Es of cancer immunoediting. Annu Rev Immunol 22, 329–360. 10.1146/annurev.immunol.22.012703.104803. - DOI - PubMed
    1. Spranger S, and Gajewski TF (2018). Impact of oncogenic pathways on evasion of antitumour immune responses. Nat Rev Cancer 18, 139–147. 10.1038/nrc.2017.117. - DOI - PMC - PubMed
    1. van Weverwijk A, and de Visser KE (2023). Mechanisms driving the immunoregulatory function of cancer cells. Nat Rev Cancer 23, 193–215. 10.1038/s41568-022-00544-4. - DOI - PubMed
    1. Casey SC, Tong L, Li Y, Do R, Walz S, Fitzgerald KN, Gouw AM, Baylot V, Gutgemann I, Eilers M, and Felsher DW (2016). MYC regulates the antitumor immune response through CD47 and PD-L1. Science 352, 227–231. 10.1126/science.aac9935. - DOI - PMC - PubMed

MeSH terms

Substances