. 2025 Aug 19;6(8):102255.
doi: 10.1016/j.xcrm.2025.102255. Epub 2025 Jul 31.

Proteogenomic characterization unveils biomarkers associated with chemoresistance in muscle-invasive bladder cancer

Affiliations

Proteogenomic characterization unveils biomarkers associated with chemoresistance in muscle-invasive bladder cancer

Matthew V Holt et al. Cell Rep Med. .

Abstract

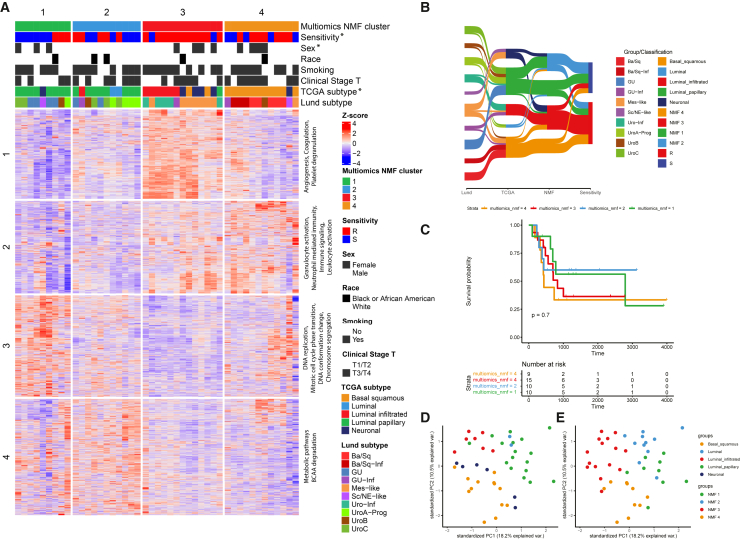
To explore potential chemoresistance mechanisms and identify therapeutic opportunities in muscle-invasive bladder cancer (MIBC), we conduct comprehensive proteogenomic characterization of 46 pre- and 14 post-treatment MIBC tumors incorporating genomics, transcriptomics, proteomics, and phosphoproteomics. Multi-omics clustering not only recapitulated established molecular subtypes but also revealed subtypes associated with chemotherapy sensitivity. Protein isoform level analysis identifies protein abundance of a short isoform of ATAD1 and RAF family proteins as biomarkers of chemosensitivity. Integration of proteomic and phosphoproteomic data reveals Wnt signaling via GSK3B-S9 phosphorylation and the JAK/STAT pathway as potential targets to overcome chemoresistance. Correlations between PD-L1 and TROP-2/NECTIN-4 indicate an additive benefit of combination therapy targeting these proteins. Overall, this study serves as a valuable resource for researchers and clinicians aiming to better understand and treat chemoresistant MIBC.

Keywords: GSK3B; RAF family; STAT3; biomarkers; chemoresistance; muscle-invasive bladder cancer; proteogenomics.


Conflict of interest statement

Declaration of interests L.E.D. is a compensated employee of StemMed Ltd. Some PDXs are exclusively licensed to StemMed Ltd., resulting in royalty income to L.E.D. P.D.C. is a partner of Sample-Kiosk. M.J.E. is the founder and shareholder of Progendis Inc (Consulting) and Bioclassifier LLC. Issued and licensing patents include Gene Expression Profiles to Predict Breast Cancer Outcomes, US pub # 20230250484, EP2297359AI. M.J.E.’s recent employment and current share options are with AstraZeneca. B.Z. received research funding from AstraZeneca and consulting fees from Inotiv. S.P.L. has funding for clinical trials from Aura Biosciences, FKD, JBL (SWOG), Genentech (SWOG), Merck (Alliance), QED Therapeutics, SURGE Therapeutics, Vaxiion, and Viventia; is a consultant/advisory board member for Aura Bioscience, BMS, Gilead, Incyte, Pfizer/EMD Serono, Protara, Surge Therapeutics, UroGen, Vaxiion, and Verity; has a patent for the TCGA classifier and received honoraria from Grand Rounds in Urology and UroToday; has stock options from Aura Biosciences; and received funds for stock options from C2I Genomics/Veracyte.

Figures

None
Graphical abstract
Figure 1
Figure 1
Cohort description, clinical exploration, omics data generation, quality control, and importance of proteomics (A) Clinical cohort flow diagram. (B) Multi-omic data availability of this cohort. The main heatmap shows each patient per column. (C) Overall survival of resistant and sensitive patients from pre-treatment samples. (D) Oncoplot showing the most frequently mutated genes in this cohort identified by whole-genome sequencing. Each column is a patient. (E) Catalogue Of Somatic Mutations In Cancer (COSMIC) Single Base Substitution signatures. SBS2 and SBS13 are attributed to APOBEC cytidine deaminases activity. SBS5 is associated with bladder cancer and ERCC2 mutations. (F) Genomic Identification of Significant Targets in Cancer (GISTIC) G-scores of significantly amplified and deleted genomic regions. (G) Histogram of RNA to protein correlations. Specific protein classes are highly or lowly correlated. (H) RNA-protein correlation analysis of protein complexes from the comprehensive resource of mammalian protein complexes (CORUM) database. Protein measurements have a stronger biological signal for predicting complexes. (I) Copy-number alteration correlation between mRNA (left) and protein (right). (J) Number of copy-number alterations that are correlated at both mRNA and protein. (K) Pathway enrichment of highly correlated CNV driver genes.
Figure 2
Figure 2
Unsupervised proteomic/multi-omic subtyping and association between subtypes and cisplatin response (A) Proteomic and phosphoproteomic non-negative matrix factorization (NMF) clustering. Proteomic and phosphoproteomic data from 42 pre-treatment samples were filtered for variance (top 10% most variable) and Z-scored. Gender-related genes account for only 3.3% of the selected genes used in clustering and thus have minor impact (removing these genes resulted in identical K-means clusters). Subsequent data frames were concatenated, and unsupervised clustering resulted in 4 NMF clusters (1, green; 2, blue; 3, red; and 4, orange). Cluster 1 is significantly enriched (p < 0.05, Fisher’s exact test) for sensitive patients, while cluster 3 is significantly enriched for resistant patients. Previous mRNA-based classification methods (TCGA and Lund) are largely encapsulated by the NMF clustering, likely due to the high correlation of mRNA and protein to subtyping genes. Pathway enrichment terms, identified through over-representation analysis (ORA) on gene members within each NMF cluster, reveal diverse pathway perturbations. Fisher’s test, ∗p < 0.05. (B) Sankey plot between subtyping algorithms on proteomics data is consistent between NMF multi-omic clusters, Lund, and TCGA mRNA subtyping algorithms. (C) Kaplan-Meier (KM) plot by NMF subtypes. NMF subtypes do not significantly differ in overall survival. Previous TCGA studies identified differential survival based on subtype; however, we do not observe this with either the TCGA subtyping or NMF subtyping likely due to our smaller sample size. NMF 3 and 4, which are associated with resistance, may have worse overall survival. Regardless, all subtypes have major attrition within the first 3 years. It is apparent that the mechanisms for resistance are complex and subtype specific. (D) PCA plot color-coded with TCGA subtypes. Distinct clusters across the first two principal components are readily observed by TCGA subtype category. (E) PCA plot color-coded with NMF subtypes.
Figure 3
Figure 3
Supervised analysis of resistance identifies WNT signaling and DNA repair as proteomic resistance mechanisms (A) Scatterplot of signed log p values for differentially regulated genes between 30 matched pre-treatment-resistant and sensitive patients at the protein (x axis) and RNA (y axis) levels. Green points are significant for both RNA and protein, red are significant for protein but not RNA, and blue are significant for RNA but not protein. (B) Hallmark activity driven by RNA and protein between sensitive and resistant. Green points are significant for both RNA and protein, red are significant for protein but not RNA, and blue are significant for RNA but not protein. (C) Volcano plot of phospho-sites between resistant and sensitive patients (n = 42). GSK3B-S9 phosphorylation site is significantly decreased in resistant patients, while GSK3B protein abundance is not significantly altered. Whiskers represent 1.5 times the interquartile range. (D) SEPEP and gene level protein abundance changes between resistant and sensitive patients. (E) (Left) Volcano plot of multiple-gene SEPEPs between sensitive and resistant patients. (Right) Boxplots of RAF1 family SEPEP and corresponding gene level protein abundance. Whiskers represent 1.5 times the interquartile range. (F) Boxplot comparing BRAF peptide LDALQQR and RAF1 peptide TPVPAQR, both of which are significantly different between sensitive and resistant based on two-sample t test. Whiskers represent 1.5 times the interquartile range.
Figure 4
Figure 4
Therapeutic targets in MIBC (A) Correlation plot of antibody-drug conjugate (ADC) target proteomics measurments from 42 pre-treatment patients. Current FDA-approved ADC targets, which are detected in all plexes, have varying distributions. As previously reported, TACSTD2 (TROP-2) and NECTIN-4 have a significant positive correlation. PD-L1 (CD274) is weakly negatively correlated with TROP and NECTIN-4 expression, suggesting a potential synergistic combination. EGFR exhibits bi-modal distribution, suggesting the existence of a subpopulation who may better respond to targeted therapy. Pearson correlation; ∗p < 0.05, ∗∗p < 0.01, and ∗∗∗p < 0.001. Whiskers represent 1.5 times the interquartile range. (B) Subtype expression patterns of ADCs. The neuronal subtype lacks high expression of TACSTD2 (TROP-2) and NECTIN-4 (n = 42 pre-treatment proteomics profiling). t test; ∗p < 0.05, ∗∗p < 0.01, and ∗∗∗p < 0.001. Whiskers represent 1.5 times the interquartile range. (C) Dependency-guided therapeutic targets. Bladder cancer cell-line dependencies from DepMap are plotted in the y axis as signed p values where negative values indicate loss of fitness upon knockout. x axis contains signed p values of proteomics expression between sensitive and resistant pre-treatment samples. Resistant associated genes are on the right side of the x axis, while sensitive associated genes are on the left. Colors represent FDA approval status. Multiple actionable proteins are differentially expressed in resistant patients, significantly impact cell-line growth when knocked out, and are primary targets of existing drugs. (D) Subtype-specific therapeutic targets. Bladder cancer cell-line dependencies from DepMap are plotted in the y axis as signed p values where negative values indicate loss of fitness upon knockout. Luminal infiltrated classified tumors, which are mostly resistant to chemotherapy, are compared against luminal papillary, which are mostly sensitive. Signed p values between the two subtypes are plotted with luminal infiltrated associated proteins on the right (positive).
Figure 5
Figure 5
Pre-post analysis of matched tumors (A) tSNE of 8 matched pre-post TMT proteomics samples. 5 out of 8 patients had a subtype switch when measured at the protein level while 2 patients had a luminal-basal subtype switch. (B) Volcano plot of protein abundance changes between pre- and post-treated patients. Lysosomal and cell trafficking genes are the top elevated genes post-chemotherapy. (C) Hallmark activity between pre- and post-treated patients. Interferon response and MYC targets are key up-regulated pathways, while coagulation, muscle differentiation, and KRAS signaling were downregulated. (D) Protein targets identified to be differential between sensitive and resistant samples are not consistently altered by chemotherapy. Individual patients showed large, but inconsistent, changes in ILK with chemotherapy. Whiskers represent 1.5 times the interquartile range. (E) Phosphorylations associated with chemotherapy. RAF1-S641 and GSK3B-S9 phosphorylations are both inactivating and significantly decreased by chemotherapy. Whiskers represent 1.5 times the interquartile range. (F) The targets of ADCs are not globally altered by chemotherapy. NECTIN-4 levels are consistent pre- and post-therapy. TACSTD2 (TROP-2) changes unpredictable with chemotherapy. Whiskers represent 1.5 times the interquartile range.
Figure 6
Figure 6
Multi-omic pathway integration diagram Signed p values for SCNA, RNA, protein, and photophosphorylation for key pathway genes. Association with sensitivity to chemotherapy is positive (blue), and association with resistance is negative (red). Multi-omic gene associations with sensitivity are blue, while resistant are red. Multiple targetable genes are associated with chemotherapy responses such as RAF, MAPK, STAT, and ILK.
Figure 7
Figure 7
Therapeutic avenues for MIBC Proteogenomics-driven therapeutic framework. Key subtyping-associated resistance and differential expression genes with potential therapies.

References

    1. Advanced Bladder Cancer (ABC) Meta-analysis Collaboration Adjuvant chemotherapy in invasive bladder cancer: a systematic review and meta-analysis of individual patient data Advanced Bladder Cancer (ABC) Meta-analysis Collaboration. Eur. Urol. 2005;48:189–199. discussion 199–201. - PubMed
    1. Grossman H.B., Natale R.B., Tangen C.M., Speights V.O., Vogelzang N.J., Trump D.L., White R.W.d., Sarosdy M.F., Wood D.P., Jr., Raghavan D., Crawford E.D. Neoadjuvant chemotherapy plus cystectomy compared with cystectomy alone for locally advanced bladder cancer. N. Engl. J. Med. 2003;349:859–866. - PubMed
    1. Griffiths G., Hall R., et al. International Collaboration of Trialists. Medical Research Council Advanced Bladder Cancer Working Party (now the National Cancer Research Institute Bladder Cancer Clinical Studies Group) European Organisation for Research and Treatment of Cancer Genito-Urinary Tract Cancer Group. Australian Bladder Cancer Study Group. National Cancer Institute of Canada Clinical Trials Group. Finnbladder. Norwegian Bladder Cancer Study Group. Club Urologico Espanol de Tratamiento Oncologico Group International phase III trial assessing neoadjuvant cisplatin, methotrexate, and vinblastine chemotherapy for muscle-invasive bladder cancer: long-term results of the BA06 30894 trial. J. Clin. Oncol. 2011;29:2171–2177. - PMC - PubMed
    1. Flaig T.W., Tangen C.M., Daneshmand S., Alva A., Lerner S.P., Lucia M.S., McConkey D.J., Theodorescu D., Goldkorn A., Milowsky M.I., et al. A Randomized Phase II Study of Coexpression Extrapolation (COXEN) with Neoadjuvant Chemotherapy for Bladder Cancer (SWOG S1314; NCT02177695) Clin. Cancer Res. 2021;27:2435–2441. - PMC - PubMed
    1. Van Allen E.M., Mouw K.W., Kim P., Iyer G., Wagle N., Al-Ahmadie H., Zhu C., Ostrovnaya I., Kryukov G.V., O’Connor K.W., et al. Somatic ERCC2 mutations correlate with cisplatin sensitivity in muscle-invasive urothelial carcinoma. Cancer Discov. 2014;4:1140–1153. - PMC - PubMed

MeSH terms

Substances