. 2025 Aug 20;45(34):e1705242025.
doi: 10.1523/JNEUROSCI.1705-24.2025.

SRC Kinase Isoforms Regulate mRNA Splicing during Neural Development

Affiliations

SRC Kinase Isoforms Regulate mRNA Splicing during Neural Development

Alastair R Pizzey et al. J Neurosci. .

Abstract

Alternative mRNA splicing generates transcriptomic diversity to direct tissue-specific functions. There is a high level of alternative splicing in the brain during embryonic development, but the master regulators of this process are poorly understood. One key splicing event in neuronal differentiation is the inclusion of a microexon in the SH3 domain of the ubiquitous tyrosine kinase, C-SRC, to yield the constitutively active, neural-specific N1-SRC kinase. We previously demonstrated that specific inhibition of N1-SRC in developing Xenopus embryos inhibits neurogenesis, but the targets and mode of action of N1-SRC were unknown. In the current study, we screened for N1-SRC SH3 domain interactors, surprisingly finding no unique targets compared with the C-SRC SH3 domain, but rather a subset of binding partners, enriched in splicing regulators. Analysis of public phosphoproteomic data revealed that SRC-dependent phosphorylation of the splicing machinery is widespread and enriched in RNA-binding proteins (RBPs). To investigate whether N1-SRC-dependent regulation of splicing underpins its role in neurogenesis, we undertook long- and short-read RNA-seq analysis of N1-SRC knockdown Xenopus embryos. We observed an upregulation of splicing factor expression and aberrant splicing of splicing regulators, principally HNRNPA1 and TRA2A. The affected splice junctions in both genes are in their glycine-rich C-termini, and junctions contain putative binding sites for SFPQ/NONO and FUS RBPs. Both SFPQ and FUS are SRC substrates, suggesting a mechanism by which N1-SRC knockdown leads to mis-splicing of HNRNPA1 and TRA2A. Thus, the neuronal splicing of C-SRC to generate N1-SRC regulates the alternative splicing landscape during neurogenesis.

Keywords: SRC; Xenopus; neurogenesis; phosphorylation; tyrosine kinase.


Conflict of interest statement

The authors declare no competing financial interests.

Figures

Figure 1.
Figure 1.
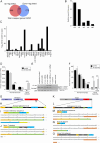
The N1-SRC SH3 domain binds a subset of C-SRC SH3 ligands enriched in regulators of mRNA metabolism. A, The plot showing the relative proportion of protein functional groups for the C- and N1-SRC SH3-specific binding partners. The Venn diagram highlights that the 33 N1-SRC SH3 binding partners are a subset of the C-SRC SH3 binders. B, A STRING network of the significant 176 C- and N1-SRC SH3 domain binding partners identified by LC-MS/MS. Nodes shaded in black represent proteins identified as binding only to the C-SRC SH3 domain. Nodes shaded in gray bind to both C-SRC and N1-SRC SH3 domains. C, A STRING network of the significant C- and N1-SRC SH3 domain binding partners identified by LC-MS/MS. Nodes colored in red represent proteins involved in RNA metabolism and are presented as a labeled network in the enlarged circled inset. D, STRING network of the N1-SRC–specific binding partners colored by the functional group. E, Immunoblots of the GST pulldown elutions with antibodies raised to representative SH3 domain binding partners (dynamin I, WASF1, and SF1). Bottom panel, Coomassie staining of the gel to confirm equal loading of the bait GST-fusion proteins. F, A plot of the relative abundance (calculated by spectral counts) of the 33 N1-SRC SH3 interactors against their C-SRC SH3 binding. (See Extended Data Fig. 1-1 for a schematic of the proteomics pipeline employed, Extended Data Fig. 1-2 for the mass spectrometry data, Extended Data Figs. 1-3 and 1-4 for functional annotation of C-SRC and N1-SRC SH3 domain interacting proteins.)
Figure 2.
Figure 2.
Expression levels of neural development genes are downregulated in N1-SRC morphants. A, A box and whisker plot of the relative expression in control and N1-SRC morphants of neural prepattern genes irx and sox3, the proneural gene neurod1, and the neuronal differentiation marker gene tubb2b as determined by RNA-seq analysis at Midneurula Stage 16. Illumina sequencing reads were mapped and quantified using Salmon. Mean expression values in TPM calculated from Salmon gene-level output. Significance is indicated by q values/FDRs as calculated by Sleuth analysis of Salmon gene-level output. B, RT-PCR analysis of neural gene expression in control and N1-SRC morphant embryos at Midneurula Stage 16. C, Fold enrichment of neural development-related PANTHERdb Biological Process GO terms associated with genes downregulated in n1-src morphants (q ≤ 0.05; log2[effect size] < 0). (See Extended Data Fig. 2-1 for a schematic of the transcriptomics pipeline employed, Extended Data Fig. 2-2 for data relating to the effectiveness of N1-SRC knockdown in morphants, Extended Data Fig. 2-3 for an analysis of gene expression in morphants, and Extended Data Fig. 2-4 for GO analysis of genes significantly downregulated in morphants.)
Figure 3.
Figure 3.
Expression levels of RNA processing genes are upregulated in N1-SRC morphants. A, Fold enrichment of RNA processing PANTHERdb Biological Process GO terms associated with genes upregulated in n1-src morphants (q ≤ 0.05; log2[effect size] > 0). B, Functional association network of genes belonging to RNA processing GO terms that are upregulated in N1-SRC morphants. Edge thickness is proportional to physical interaction data from STRING-db. Nodes are colored according to the function: red, RNA splicing; blue, ribosome biogenesis; gray, other. (See Extended Data Fig. 3-1 for GO analysis of genes significantly upregulated in morphants.)
Figure 4.
Figure 4.
Transcript isoform usage is altered in a subset of genes in N1-SRC morphant embryos. A, A Venn diagram showing the overlap of genes with both up- and downregulated transcripts in N1-SRC morphants. B, Frequency histogram of splicing events altered in n1-src morphants. ES, exon skipping; IR, intron retention; A5, altered 5′ splice site; A3, altered 3′ splice sites; ME, mutually exclusive exon splicing. C, A plot of the Gene Switch Q-value calculated by IsoformSwitchAnalyzeR for each validated isoform switch in n1-src morphants. D, The relative abundance of hnrnpa1 transcripts from IsoformSwitchAnalyzeR plotted for controls and n1-src morphants. Novel transcripts in n1-src morphants are grouped together. Statistically significant comparisons of differential expression between control and n1-src are indicated; ***p < 0.001. Standard error bars are shown. E, RT-PCR analysis of n1-src, hnrnpa1, and loading control rpl8 transcripts at Neurula Stage 16 in uninjected control, control morpholino injected, n1-src splice-blocking morpholinos injected, n1-src mRNA injected, and n1-src splice-blocking morpholinos and n1-src mRNA coinjected embryos. Black arrows indicate different hnrnpa1 splice isoforms. F, The relative abundance of tra2a transcripts from IsoformSwitchAnalyzeR plotted for controls and n1-src morphants. G, Domain structure of the Hnrnpa1 protein: GRD, glycine-rich domain; RRM, RNA recognition motif. M9, nuclear import/export regulatory sequence. H, Detail of the exon/intron structure of the carboxy terminal, the GRD encoding region of hnrnpa1. I, The Hnrnpa1 reference protein sequence. Regions encoded by exons 6, 7, and 8 are indicated. J, The conceptual peptide sequence encoded by hnrnpa1 transcripts with retained intron 7. K, Domain structure of the Tra2a protein: GD, glycine-rich domain; RRM, RNA recognition motif; SRD, serine-/arginine-rich domain. L, Detail of the exon/intron structure of the carboxy terminal, glycine-rich, and serine-rich encoding region of tra2a. M, The Tra2a reference protein sequence. Regions encoded by exons 5, 6, 7, and 8 are indicated. N, The conceptual peptide sequence encoded by tra2a transcripts with skipped exon 6. O, The conceptual peptide sequence encoded by tra2a transcripts with retained intron 5 and 6. (See Extended Data Fig. 4-1 for the LR transcriptome, Extended Data Fig. 4-2 for an analysis of transcript expression in morphants, Extended Data 4-3 for additional data relating to genes with altered splicing in morphants, Extended Data Fig. 4-4 for GO analysis of transcripts differentially expressed in morphant embryos, and Extended Data Fig. 4-5 for data relating to the IsoformSwitchAnalyzeR-based analysis of altered splicing events.)
Figure 5.
Figure 5.
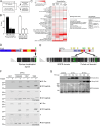
RBPs identified as SRC kinase substrates have consensus binding sites at splice junctions in Hnrnpa1 and Tra2a. A, The regions with altered splicing of the hnrnpa1 and tra2a transcripts. The 100 base regions flanking the 5′ end of affected introns are designated IR1 and IR2. The 100 base regions flanking the 3′ end of affected introns are designated IR3 and IR4. B, Heatmap of consensus RBP sites identified in the IR1-IR4 regions of hnrnpa1 intron 7 and tra2a introns 5 and 6 (scale bar, 0–6 site counts). Singleton RBP sites were eliminated from the analysis (only RBP sites present in >1 region are included). C, Consensus Nono/Sfpq heterodimer and Fus binding sites in the intron 7 region of hnrnpa1. Exon sequence is shaded gray and in uppercase. D, Consensus Nono/Sfpq heterodimer and Fus binding sites in the skipped exon 6 region of tra2a. E, Consensus Nono/Sfpq heterodimer and Fus binding sites in the retained intron 6 region of tra2a. (See Extended Data Figs. 5-1 and 5-2 for data relating to the analysis of hnrnpa1 and tra2a splice junctions for consensus RBP sites.)
Figure 6.
Figure 6.
The splicing machinery is phosphorylated by SRC kinases. A, The pipeline for the bioinformatic analysis to determine SRC-dependent substrates in the splicing machinery in the PhosphoSitePlus database. B, A plot of the percentage of serine, threonine, and tyrosine phosphosites in the complete PhosphoSitePlus database (left bars) or for proteins identified as splicing machinery (right bars). C, Heatmap depicting the percentage of proteins (Column 1 only) or tyrosine phosphosites attributed to different subclasses of the splicing machinery within the indicated datasets. The number of proteins analyzed in each dataset is indicated. The table (right) summarizes the splicing factors that have been experimentally determined to be Src substrates. D, Domain structure of the FUS protein with a multiple sequence alignment of FUS nuclear localization signal sequences from rat, human, Xenopus, and zebrafish showing conserved C-terminal phosphotyrosine residue. GRD, glycine-rich domain; NES, nuclear export signal; NLS, nuclear localization signal; PrLD, prion-like domain; RRM, RNA recognition motif; ZnF, zinc finger domain. E, Domain structure of the SFPQ protein with a multiple alignment showing conservation of peptide sequences in the NOPS and coiled domain in rat, human, Xenopus, and zebrafish SFPQ. Green coloring indicates conserved phosphotyrosine sites. Yellow lollipops indicate phosphotyrosine residues identified in the PhosphoSitePlus database and green are predicted Src sites. GRD, glycine-rich domain; NOPS, NONA/ParaSpeckle domain; RRM, RNA recognition motif. F, In vitro C-SRC and N1-SRC kinase assays using GST-peptide fusions of SFPQ, encoding predicted Src consensus motifs. Phosphorylation was detected by immunoblotting with a phosphotyrosine antibody (pY), and recombinant protein levels in each assay were detected by Coomassie staining. GST was included as a negative control, and GST-YEEI is an ideal Src substrate. The asterisk indicates autophosphorylation of SRC proteins. G, Western blot of Neurula Stage 17 Xenopus embryos injected with the indicated amounts of synthetic C-SRC and N1-SRC mRNA. Uninjected embryos and embryos injected with 500 pg monomeric red fluorescent protein (mRFP) are included as negative controls. Translated SRC proteins are detected by the FLAG epitope tag. Activity of SRC proteins is detected by autophosphorylation of Y416. Coomassie staining of total loaded proteins is used as a loading control. (See Extended Data Fig. 6-1 for data relating to the phosphosite analysis of RNA splicing proteins and Extended Data Fig. 6-2 for the phenotypes of Xenopus embryos injected with C-Src and N1-Src mRNA.)
Figure 7.
Figure 7.
A model for N1-SRC function during neuronal specification and differentiation.

References

    1. Amanchy R, et al. (2008) Identification of c-Src tyrosine kinase substrates using mass spectrometry and peptide microarrays. J Proteome Res 7:3900–3910. 10.1021/pr800198w - DOI - PMC - PubMed
    1. Bjelfman C, Hedborg F, Johansson I, Nordenskjöld M, Påhlman S (1990) Expression of the neuronal form of pp60c-src in neuroblastoma in relation to clinical stage and prognosis. Cancer Res 50:6908–6914. 10.1128/mcb.10.1.361-370.1990 - DOI - PubMed
    1. Bjorge JD, Jakymiw A, Fujita DJ (2000) Selected glimpses into the activation and function of Src kinase. Oncogene 19:5620–5635. 10.1038/sj.onc.1203923 - DOI - PubMed
    1. Brugge JS, Cotton PC, Queral AE, Barrett JN, Nonner D, Keane RW (1985) Neurones express high levels of a structurally modified, activated form of pp60c-src. Nature 316:554–557. 10.1038/316554a0 - DOI - PubMed
    1. Brunton VG, Avizienyte E, Fincham VJ, Serrels B, Metcalf CA 3rd, Sawyer TK, Frame MC (2005) Identification of Src-specific phosphorylation site on focal adhesion kinase: dissection of the role of Src SH2 and catalytic functions and their consequences for tumor cell behavior. Cancer Res 65:1335–1342. 10.1158/0008-5472.CAN-04-1949 - DOI - PubMed

LinkOut - more resources