Clinical Trial
. 2025 Aug 1;16(1):7064.
doi: 10.1038/s41467-025-62249-0.

Tumor control and immune activation through palliative irradiation and ATR inhibition, PATRIOT Part C: a phase Ib trial

Affiliations
Clinical Trial

Tumor control and immune activation through palliative irradiation and ATR inhibition, PATRIOT Part C: a phase Ib trial

Magnus T Dillon et al. Nat Commun. .

Abstract

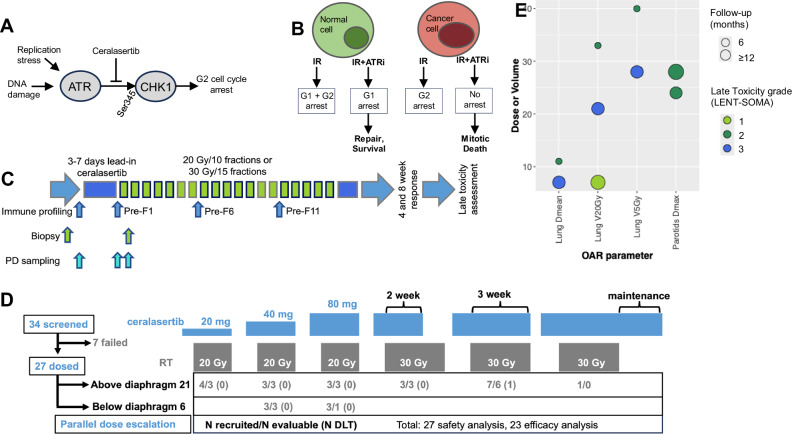
Ataxia telangiectasia and Rad3-related kinase (ATR) is a rational radiosensitization target. In this study, we explore the combination of the ATR inhibitor, ceralasertib, and palliative radiotherapy, with primary endpoint the identification of maximum tolerated dose, and secondary endpoints the determination of adverse event causality, pharmacokinetics (PK) and anti-tumor activity. Twenty-seven patients were dosed in escalating dose cohorts from 20 to 80 mg twice daily (BD) with concomitant radiation, 20 Gy in 10 fractions or 30 Gy in 15 fractions. Patients were assessed for acute and late toxicities and response after therapy. A non-tolerated dose was not reached. Maximum administered dose was 80 mg BD ceralasertib over 3 weeks with 30 Gy in 15 fractions, at which 1/6 evaluable patients had dose-limiting toxicities (radiation dermatitis and mucositis). PK was comparable to monotherapy. Of 23 efficacy-evaluable participants, 2 (9%) had complete response (CR), 6 (26%) partial response (PR), 13 (57%) stable disease (SD) and 2 (9%) progressive disease (PD) as best response in irradiated tumors. Response was not clearly linked to genomic aberrations. Increased T and natural killer cell activation as observed in peripheral blood as treatment progressed.


Conflict of interest statement

Competing interests: K.E.S is an employee of The Institute of Cancer Research, which is involved in the development of PI3K, HSP90, HDAC, AKT, ROCK, RAF, CHK1, and HSF1 inhibitors. C.J.L. makes the following disclosures: receives and/or has received research funding from: AstraZeneca, Merck KGaA, Artios, Neophore. Received consultancy, SAB membership or honoraria payments from: Syncona, Sun Pharma, Gerson Lehrman Group, Merck KGaA, Vertex, AstraZeneca, Tango, 3rd Rock, Ono Pharma, Artios, Abingworth, Tesselate, Dark Blue Therapeutics, Pontifax, Astex, Neophore, Glaxo Smith Kline, Dawn Bioventures. Has stock in: Tango, Ovibio, Hysplex, Tesselate. U.B. reports research funding, honoraria and advisory board membership for Chugai Pharmaceutical, Verastem Inc., and Carrick Therapeutics K.J.H. reports honoraria (inst.): ALX Pharma, Arch Oncology, AstraZeneca, Bicara Therapeutics, BMS, Boehringer Ingelheim, Codiak Biosciences, F-Star Therapeutics, Inzen Therapeutics, Merck Serono, Merus, MSD, Oncolys Biopharma, Pfizer, Replimune, VacV Biotherapeutics; Consulting or Advisory Role (inst.): Arch Oncology, AstraZeneca, BMS, Boehringer Ingelheim, Inzen Therapeutics, Merck Serono, MSD, Oncolys BioPharma, Replimune; Speakers’ Bureau (inst.): BMS, Merck Serono, MSD; Research Funding (inst.): AstraZeneca, Boehringer Ingelheim, Merck Sharp & Dohme, Replimune. E.D., S.A.S., N.S. are employees of AstraZeneca with stock ownership. The remaining authors declare no competing interests.

Figures

Fig. 1
Fig. 1. Study rationale.
A Schematic of ATR function. ATR phosphorylates CHK1, on Serine 345, after DNA damage or replication stress. Activated CHK1 causes a predominantly G2 cell cycle arrest. Ceralasertib prevents ATR activating CHK1. B Schematic for tumor selectivity. Normal cells have intact G1 and G2 cell cycle checkpoints, most tumor cells have impaired G1 checkpoint control and will, therefore, be more at risk from G2 checkpoint inhibition when combined with DNA damage. C Study schema for drug and radiation dosing, PD sampling, response and toxicity assessments. Blue boxes: lead-in and post-radiotherapy ceralasertib; green boxes: radiotherapy treatments, grey outline: weekend with ceralasertib and no radiotherapy. D Schema for escalation of ceralasertib and radiotherapy (RT) doses. RT dose in Gy, (2 Gy fractions); ceralasertib dose in mg BD. E Late toxicities identified through medical notes review, AE reporting or LENT-SOMA assessment, compared with radiation dose-volume parameters. All indicated participants received ceralasertib 80 mg BD and 30 Gy in 15 fractions radiation. Density indicates length of available follow-up for that participant, and color indicates toxicity grade. Dmax maximum point dose, Dmean mean organ dose, VxGy volume of organ receiving x Gy, D10cc dose to most irradiated 10 cc of organ. Source data are provided online.
Fig. 2
Fig. 2. Pharmacokinetics and pharmacodynamics.
A Ceralasertib PK. PK samples were taken on the days of PD sampling, pre- and 4–8 h post-dose. Individual points are shown, line = mean, error = 95% confidence interval. B PBMC phospho(S345)Chk1 immunofluorescence intensity, plotted as fold-change vs. baseline levels, pre-fraction 1 (after 3–7 days ceralasertib dosing) and pre-fraction 2 (after a single fraction of 2 Gy radiation), by dose cohort, line = median, box = interquartile range, whisker = range. n = 3 (20 mg BD), n = 4 (40 mg BD), n = 9 (80 mg BD). C PBMC phospho(S345)Chk1 immunofluorescence intensity, individual points as shown in (B). Size of points = dose (mg BD), color indicates corresponding pre-dose plasma ceralasertib level, if available (grey: not available). * = P = 0.035 by two-sided Wilcoxon Signed Rank test, versus a theoretical median of 1. Data includes one-sample where pre-F1 and pre-F2 samples were mixed, this has been included in both pre-F1 and pre-F2 columns. Source data for this figure (AD) are provided online. D γH2AX foci in skin punch biopsies, absolute count of foci per nucleus, median of 765 (range 72–2204) nuclei were quantified per patient per time point, number of nuclear foci per nucleus displayed. * = P = 0.024 by unpaired t-test (two-tailed), comparing pre-F2 to baseline. E Representative micrographs of skin-punch biopsies stained for γH2AX by IHC. Left = baseline; middle = pre-fraction 1; right = pre-fraction 2. Scale bar = 50 μm. F Tumor pharmacodynamics in paired tumor biopsies before treatment and prior to fraction 2. Left: change in γH2AX % positivity; right: change in phospho(S635)Rad50 % positivity. G Example micrographs for the tumor biopsies quantified in (G). Scale bar = 100 μm.
Fig. 3
Fig. 3. Tumor responses.
AE example responses with corresponding radiotherapy plans. Legend indicates the isodose levels, expressing the percentage of prescribed radiation dose (either 20 or 30 Gy). Red arrowheads indicate the tumor. A metastatic squamous cell carcinoma of the larynx, mediastinal node treated with 20 Gy and 20 mg BD ceralasertib, best response was PR. B metastatic SCCHN, acetabulum metastasis treated with 20 Gy and 40 mg ceralasertib, best response was PR. C SCCHN (hypopharynx) treated with 20 Gy and 40 mg ceralasertib, best response was PR and later clinical CR. D SCCHN (oropharynx) treated with 30 Gy and 80 mg ceralasertib, best response was PR. E SCCHN treated with 30 Gy and 80 mg ceralasertib, best response was PR. F spider plot of change in diameter, compared to baseline measurement, for irradiated lesions only. G waterfall plot, of change in diameter, compared to baseline measurement, for irradiated lesions only. H Swimmer plot, indicating clinical course for each participant.
Fig. 4
Fig. 4. Tumor profiling.
A Oncoprint of DNA sequencing data for 20 participants. Tumor: whole exome sequencing (“exome”) or customized panel (“panel”; gene list in Supp. Table 2). Plasma: customized panel (gene list in Supp. Table 3). SLD: change in sum of longest diameter of irradiated lesion. Histology: H&N other: other non-squamous head and neck tumors. Ceralasertib dose in mg BD. RT: radiation dose in Gy. BOR: best overall response (by RECIST: CR complete response, PR partial response, SD stable disease, PD progressive disease). G1: genes involved in G1 cell-cycle checkpoint control. DDR: genes involved in DNA damage repair pathways. B Quantification of tumor-infiltrating lymphocytes (TIL) in H&E sections of available tumors. TIL density was quantified in tumor and stromal regions: 3 tumors with CR/PR and 5 with SD or PD were quantified, whole tumor area lymphocyte count. * = P = 0.036 by two-sided Mann–Whitney test. Source data are provided online. C Volcano plot of differentially expressed genes in on-treatment (pre-fraction 2) vs. baseline tumor biopsies for n = 2 paired tumors. Fold-change of treatment versus control: effect size calculated in DESeq2 R package; p-value: Wald test p-value with Benjamini–Hochberg adjustment. Genes of interest indicated. D Gene set enrichment analysis performed for the data shown in (C) using the “hallmarks” gene set. NES normalized enrichment score, FDR Q False discovery rate Q value, EMT epithelial-mesenchymal transition. E Cell-type deconvolution of RNAseq data for the 2 available paired biopsies using CIBERSORTx. Mean fold-change vs. baseline cell-type scores is shown. Source data are provided online. F Cell-type deconvolution of cell type infiltration using mMCPcounter at day 3 and day 10 after irradiation in a mouse model of head and neck cancer. Animals were treated with 4 fractions of 2 Gy and ATRi 25 mg/kg/day for 7 days, starting 2 h before the first fraction of radiation, 3 animals per group. Mean fold-change in cell-type scores vs. vehicle-treated animals for the same time-point is shown. Error bars = SEM. Source data are provided online.
Fig. 5
Fig. 5. Immune profiling of PBMCs.
A Percentage of indicated cell types in lymphocyte gate at baseline, before fraction 1 (“Pre-F1”, after 3–7 days’ ceralasertib); fraction 6 (“Pre-F6”, after 1 week of radiation with ceralasertib); fraction 11 (“Pre-F11” after 2 weeks of radiation with ceralasertib). B average Log2 fold-change versus baseline sample of indicated activation markers on CD8, CD4, unconventional (CD3+CD4CD8) T cells and NK cells. C Change in percentages of CD8-positive T-cells and NK cells positive for indicated activation markers, CD95 and CD69. Each point represents an individual patient (n = 6–7 patients per group), percent positivity of indicated subpopulations of lymphocytes. Statistical significance: mixed effects model with Geisser-Greenhouse correction and Fisher’s Least Significance Difference test to compare time points without multiple comparisons testing. D Fold-change versus baseline in percent CD69-positive CD8 cells. “Day 14” is fold-change vs. baseline for participants treated with ceralasertib 160 mg BD monotherapy in PATRIOT Part A/B study (n = 8). Each point represents an individual patient (n = 6–7 patients per time point), fold-change percent positivity versus individual baseline sample. Two-sided p-values: one-sample t-test against hypothetical median of 1. Line: mean; error bars: SEM. E Fold-change versus baseline in percent NKG2A-positive NK cells. “Day 14” is fold-change vs. baseline for participants treated with ceralasertib 160 mg BD monotherapy in PATRIOT Part A/B study (n = 8). Each point represents an individual patient (n = 6–7 patients per time point). Two-sided p-values: one-sample t-test against a hypothetical median of 1. Line: mean; error bars: SEM. F Representative flow cytometry plot showing change in NKG2A- and PD-1-positive CD8 T-cells with treatment (baseline and before the 6th fraction of radiotherapy). G Upper row: change in mean percentage of NKG2A- and PD-1-positive CD8 T-cells (upper left) and CD4 T cells (upper right). Lower row: fold-change in proportion of NKG2A- and PD-1-positive CD8 (lower left) and CD4 (lower right) T-cells. Error bars: SEM. Source data for this figure (A, BE, G, H) are provided online. H Plasma cytokines were measured at baseline, prior to fraction 1 and prior to fraction 2. Fold-change versus baseline is plotted, color indicates best overall response of irradiated lesions. * = two-sided p = 0.013 by Wilcoxon Test vs. a hypothetical median of 1.

References

    1. Dillon, M. T. et al. Radiosensitization by the ATR Inhibitor AZD6738 through Generation of Acentric Micronuclei. Mol. Cancer Ther.16, 25–34 (2017). - PMC - PubMed
    1. Cimprich, K. A. & Cortez, D. ATR: an essential regulator of genome integrity. Nat. Rev. Mol. Cell Biol.9, 616–627 (2008). - PMC - PubMed
    1. Dillon, M. T., Good, J. S. & Harrington, K. J. Selective targeting of the G2/M cell cycle checkpoint to improve the therapeutic index of radiotherapy. Clin. Oncol. (R. Coll. Radio.)26, 257–265 (2014). - PubMed
    1. Dillon, M. T. et al. ATR inhibition potentiates the radiation-induced inflammatory tumor microenvironment. Clin. Cancer Res.25, 3392–3403 (2019). - PMC - PubMed
    1. Vendetti, F. P. et al. ATR kinase inhibitor AZD6738 potentiates CD8+ T cell-dependent antitumor activity following radiation. J. Clin. Investig.128, 3926–3940 (2018). - PMC - PubMed

Publication types

MeSH terms