. 2025 Aug 1;16(1):7061.
doi: 10.1038/s41467-025-62364-y.

Lung structural cells are altered by infeluenza virus leading to rapid immune protection following re-challenge

Affiliations

Lung structural cells are altered by infeluenza virus leading to rapid immune protection following re-challenge

Julie C Worrell et al. Nat Commun. .

Abstract

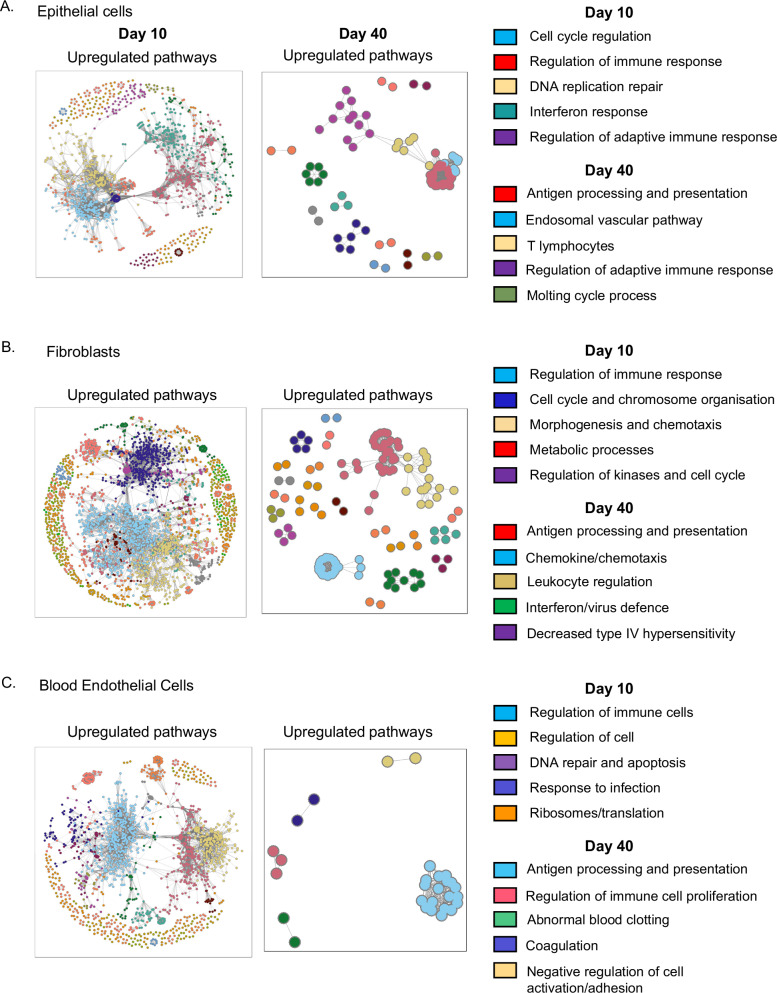
Lung structural cells form barriers against pathogens and trigger immune responses following infections. This leads to the recruitment of innate and adaptive immune cells some of which remain within the lung and contribute to enhanced pathogen control following subsequent infections. There is growing evidence that structural cells also display long-term changes following infection. Here we investigate long-term changes to mouse lung epithelial cells, fibroblasts, and endothelial cells following influenza virus infection finding that all three cell types maintain an imprint of the infection, particularly in genes linked to communication with T cells. MHCI and MHCII proteins continue to be expressed at higher levels in both differentiated epithelial cells and progenitor populations and several differentially expressed genes are downstream of the transcription factor, SpiB, a known orchestrator of antigen presentation. Lung epithelial cells from influenza-infected mice display functional changes, more rapidly controlling influenza virus than cells from naïve animals. This rapid anti-viral response and increased expression of molecules required to communicate with T cells demonstrates sustained and enhanced functions following infection. These data suggest lung structural cells display characteristics of immune memory which could affect outcomes that are protective in the context of infection or pathogenic in chronic inflammatory disorders.


Conflict of interest statement

Competing interests: The authors declare no competing interests.

Figures

Fig. 1
Fig. 1. IAV infection induces conserved transcriptional changes at day 10 and 40 post infection.
RNA sequencing was performed on sorted lung epithelial cells, fibroblasts, and blood endothelial cells (BEC) from naive and C57BL/6 mice infected with influenza A virus (IAV) 10 (A, B) or 40 (C, D) days previously. A, C Differentially expressed genes (DEG) with a twofold change and a False Discovery Rate q value < 0.05 in lung structural cells were considered statistically significant. 7–8 mice were combined to make four samples per timepoint. B, D Volcano plots show the relationship between the fold change and the associated p value with the top 10 DEG by fold change. E Venn diagrams showing overlap between differentially expressed upregulated genes at day 10 and 40 post IAV infection. Source data in E are provided as a Source Data file.
Fig. 2
Fig. 2. Network analysis shows conserved upregulation of genes involved in antigen processing and presentation in lung structural cells at day 40 post-IAV infection.
Networks of all significantly enriched gene sets in epithelial cells A, fibroblasts B, and blood endothelial cells C, highlighting significance and gene set interconnectivity. Networks are given for enrichment amongst all significantly differentially expressed genes (p.adjusted <0.05, absolute log2 fold >0.5) between day 10 and naive, and day 40 and naive. Enrichment analysis was performed using Hyper-geometric Gene Set Enrichment on the gene set databases STRING11.5. For each network, nodes represent gene sets and edges represent two gene sets with a Szymkiewicz-Simpson coefficient of at least 0.5. Colors are defined in the Figure.
Fig. 3
Fig. 3. Spib is upregulated in lung epithelial cells adjacent to areas of inflammation, and this is dependent on viral replication.
Upregulated genes at both day 10 and 40 post-infection from the experiments described in Fig. 1 were compared with target genes of the transcription factor, SpiB, identified using a publicly available ChiPseq dataset (Solomon et al.) A Heatmaps show SpiB target genes in epithelial cells and fibroblasts, respectively. Expression across each gene (row) is scaled, with a Z-score computed for all Differentially Expressed Genes (DEG). Targets specific to epithelial cells (blue boxes), targets specific to fibroblasts (pink boxes) and those that overlap between cell types (purple boxes). Samples with relatively high expression of a given gene are marked in red, and samples with relatively low expression are marked in blue. B Venn diagram shows overlap between SpiB target genes and DEG in lung epithelial cells (blue) and fibroblasts (pink) post IAV infection. C Lungs were taken from naive or C57BL/6 mice infected with influenza A virus (IAV) 30–40 days previously, with representative images from mice from two independent experiments shown. Areas of infected lungs with no inflammation have Spib negative airways, while Spib (black arrows) is localized in areas of inflammation (dark red color, indicated by white star) within the lung and in airways; adjacent images showing areas of no inflammation and inflammation show lungs from the same mouse. Data are from 4 to 6 mice per experimental group, combined from two independent experiments. Each symbol represents a lobe from a mouse, with each mouse only represented once in each column, and bars show the median with the interquartile range, as data are not normally distributed. Data analyzed using Kruskal–Wallis with Dunn’s post hoc comparison test. D C57BL/6 mice were infected intranasally with IAV (either wildtype (WT) or single cycle (S-FLU), Airways (Aw), blood vessels (Bv), inflammatory foci/immune cell clusters (labeled with white stars) and SpiB positive airway epithelial cells (black arrows). All scale bars are 200 µm. Source data in A and C are provided as a Source Data file.
Fig. 4
Fig. 4. SpiB+ epithelial cells express more MHCII than SpiB-negative cells.
SpiB-mCherry reporter mice were infected with influenza A virus (IAV) (100-200PFU) and lungs taken at day 0, 10, or 30 post infection. EpCAM1+ epithelial cell populations were identified by gating on lineage (CD45, CD31, and CD140a) negative, SpiB negative or SpiB+ populations. A Frequency of SpiB positive or negative lung epithelial cells by cell subset in naive mice; the p values indicate that the population is present at a significantly greater percentage within the SpiB negative or positive subsets the color code is indicated in the figure. B Frequency of MHCII+ cells by each epithelial cell subset in naive mice. C Numbers of SpiB negative or positive populations at the different timepoints. D Percentage and E MFI of each population expressing MHCII at day 0, 10 and 30 post infection. In all experiments, data are combined with N = 11 naive, N = 7 primary, and N = 10 memory from two independent experiments. A Data show mean with SEM and differences tested by a one-way ANOVA and Šidák’s multiple comparison test with p values located in the group in which the cell type is present at a higher frequency. BE each symbol represents a mouse and the bars show means with SEM error bars for normally distributed data and median with interquartile range for non-normally distributed data. B All data are normally distributed apart from Sca1+ progenitor cells. C All data are not normally distributed apart from Sca1 progenitor and Alveolar type (AT)II cells. D All data are normally distributed apart from Sca1 progenitor cells. E All data are not normally distributed apart from ciliated and club cells. B Normally distributed data are tested via paired t tests and non-normal by a paired Wilcoxon test. C, D normally distributed data are tested via a one-way ANOVA with a Šidák’s multiple comparison test and non-normal by a one-way Kruskal–Wallis test followed by a Dunn’s multiple comparisons test. Source data for all panels are provided as a Source Data file.
Fig. 5
Fig. 5. Influenza virus infection leads to the sustained presence of populations of epithelial cells expressing high levels of MHCI and MHCII.
SpiB-mCherry reporter mice were infected with Influenza A Virus IAV-WSN (100-200PFU) and lungs taken at day 0, 10, or 30 post infection. EpCAM1+ epithelial cell populations were identified by gating on lineage (CD45, CD31, and CD140a) negative, SpiB negative or SpiB+ populations. A shows representative staining of MHCII and MHCI expression by ciliated, club and Sca1 progenitor cells at each timepoint. B Data are not normally distributed, each symbol represents a mouse and the bars show median with interquartile range. Differences between timepoints were tested by a one-way Kruskal–Wallis test followed by a Dunn’s multiple comparisons test and separately between SpiB negative and positive populations by paired one-way Wilcoxon rank test. Data are from two independent experiments at each timepoint with a total of n = 21 naive; n = 10 day 10; and n = 10 day 30 mice. Source data for 5B are provided as a Source Data file.
Fig. 6
Fig. 6. Epithelial cells from IAV re-challenged mice have less virus than those from primary infected animals.
C57BL/6 mice that were either naive or infected 30 days earlier with influenza A virus (IAV)-WSN, were infected with IAV-X31, their lungs harvested 2 days later, and epithelial cells and fibroblasts examined by flow cytometry. A The percentages and number or EpCAM1+ cells positive for IAV-Nucleoprotein (NP) were examined by flow cytometry, gated as shown in SFig. 7C. B The percentages of each epithelial cell type that were IAV-NP+. C Representative FACS plots of IFN-responsive fibroblasts indicating positive populations, cells are gated on live, single, dump negative (CD45/CD31/EpCAM1) cells that are CD140a+ gated on CD49e+ CD9+ fibroblasts that are Bst2+ as shown in SFig. 9B. D the percentages and numbers of IFN-responsive fibroblasts. Data are from two independent experiments combined. Primary: n = 8, re-infection: n = 9. In all graphs, each symbol represents a mouse, and the bars show means with SEM error bars for normally distributed data and median with interquartile range for non-normally distributed data. A Data are not normally distributed. B All data are not normally distributed apart from club cells. D The percentages and numbers of IFN-responsive fibroblasts are not normally distributed. In all graphs, normally distributed data tested via one-way t test, and non-normally distributed data tested via one-way Mann–Whitney test. Source data for A, B, D are provided as a Source Data file.
Fig. 7
Fig. 7. Spatial analysis of gene expression in primary and re-infected animals show altered inflammatory and type I IFN response and increased IFNγ response in re-infected animals.
C57BL/6 mice that were either naive or infected 30 days earlier with Influenza A virus (IAV-WSN), were infected with IAV-X31, their lungs harvested 2 days later, their epithelial cells sorted by FACS and their gene expression analyzed by Nanostring nCounter or lungs fixed and embedded in paraffin. A, B Heatmap and example boxplots showing Differentially Expressed Genes (DEG) from primary or re-infected animals in FACS sorted epithelial cells. DEG with a twofold change and an FDR q value < 0.05 in lung epithelial cells were considered statistically significant to take into account multiple comparisons. Primary group (n = 4) and re-challenge group (n = 7), data are from two independent experiments combined and each dot represents a mouse, the bounds of the boxes are the 25–75th percentiles, the lines in the boxes are at the median and the whiskers show the min and the max values. C RNAscope analysis for X31-IAV was performed on FFPE lung tissue; representative X31-IAV+ areas are shown in red and labeled with black arrows to highlight virus + bronchial epithelium. Bars, 200 micrometers. Virus-positive and negative airways from six primary and three re-infected mice were analyzed by GeoMX. D DEG between normal tissue and three areas: virus+ airway cells; virus negative cells within the same airway (Close); and adjacent virus negative airways (Further) were classified based on presence within MGI GO terms ‘Inflammation’ or ‘Type 1 IFN’. E Heatmap showing DEG between X31-IAV positive airways in primary versus re-challenge groups, DEG with a twofold change and an FDR q value < 0.05 in lung epithelial cells were considered statistically significant. F Enriched pathways found in DEG identified between viral+ airways in day 2 primary or re-infected C57BL/6 mice analyzed by GeoMx. The x axis represents the −log10 of the P value given during the analysis; (FDR < 0.05 to take into account multiple comparisons) with the number of DEG listed from each pathway. Source data for B, D, and F data are provided as a Source Data file.
Fig. 8
Fig. 8. Infection-experienced lung structural cells display enhanced viral control and can reactivate T cells.
A C57BL/6 mice were infected with influenza A virus (IAV)-WSN on day 0 and treated with 400μg isotype control or 200μg each of anti-CD4 (GK1.5) and anti-CD8 (2.43) on days 28 and 30 when mice were (re)-infected with IAV-X31. Lung IAV titers were examined 2 days post-IAV infection, and data were combined from two experiments: primary (n=9) mice, recall IgG (n=9), and recall aCD4/aCD8 (n=11). B Experimental design of IAV infection, in vitro re-challenge and co-culture, schematic created in BioRender; Worrell, J. (2025) https://biorender.com/hwavd50. Lung CD45-negative cells were isolated from naive or IAV-WSN-infected mice 30 days earlier. After 24 hours, the cells were infected with IAV-X31 and the cells were examined by flow cytometry after a further 24 hours or co-cultured with T cells from the spleens of day 9 IAV-X31-infected mice infected. C Percentage of CD44hi CD4/CD8 T cells that were CD25+ or CD69+ , normalized to the mean of the no infection control within each of the two experiments, n = 4 mice per group in each experiment. D Representative FACS plots and data for IAV-Nucleoprotein (NP) for each cell type, graphed data are the average of two technical replicates per mouse. Cells were gated on live, single, CD45-negative EpCAM1+ (epithelial cells), CD140+ (fibroblasts), and CD31+ (blood endothelial cells). Numbers in plots indicate the percentages of cells that are IAV-NP + . E Supernatants from the infected cultures were tested for multiple immune mediators by Luminex 24 hours after in vitro infection. Data in D, E combined from the same two experiments: Primary: n = 8, Re-infection: and n = 7; in D one sample in the IAV-memory/IAV-31 group was lost due to a technical error during acquisition. In all graphs, each symbol represents a mouse, and the bars show means ± SEM for normally distributed data and median with interquartile range for non-normally distributed data. A Data are not normally distributed. CD4 data are not normally distributed, and CD8 data are normally distributed. D Epithelial cell and BEC data are normally distributed, and fibroblast data are not normally distributed. E All data are normally distributed. AD non-normally distributed data tested with a one-way Kruskal-Wallis test followed by a Dunn’s multiple comparisons test. C, D normally distributed data tested by a one-way ANOVA followed by Šidák’s multiple comparison test. E Data tested by a one-way t-test. Source data for A, CE data are provided as a Source Data file.

References

    1. Nair, H. et al. Global burden of respiratory infections due to seasonal influenza in young children: a systematic review and meta-analysis. Lancet378, 1917–1930 (2011). - PubMed
    1. Somes, M. P., Turner, R. M., Dwyer, L. J. & Newall, A. T. Estimating the annual attack rate of seasonal influenza among unvaccinated individuals: a systematic review and meta-analysis. Vaccine36, 3199–3207 (2018). - PubMed
    1. Boyd, D. F. et al. Exuberant fibroblast activity compromises lung function via ADAMTS4. Nature587, 466–471 (2020). - PMC - PubMed
    1. Fay, E. J. et al. Cell type- and replication stage-specific influenza virus responses in vivo. PLoS Pathog.16, e1008760 (2020). - PMC - PubMed
    1. Ioannidis, I. et al. Plasticity and virus specificity of the airway epithelial cell immune response during respiratory virus infection. J. Virol.86, 5422–5436 (2012). - PMC - PubMed

LinkOut - more resources