. 2025 Aug 1;16(1):7068.
doi: 10.1038/s41467-025-62339-z.

Structural convergence and water-mediated substrate mimicry enable broad neuraminidase inhibition by human antibodies

Affiliations

Structural convergence and water-mediated substrate mimicry enable broad neuraminidase inhibition by human antibodies

Julia Lederhofer et al. Nat Commun. .

Abstract

Influenza has been responsible for multiple global pandemics and seasonal epidemics and claimed millions of lives. The imminent threat of a panzootic outbreak of avian influenza H5N1 virus underscores the urgent need for pandemic preparedness and effective countermeasures, including monoclonal antibodies (mAbs). Here, we characterize human mAbs that target the highly conserved catalytic site of viral neuraminidase (NA), termed NCS mAbs, and the molecular basis of their broad specificity. Cross-reactive NA-specific B cells were isolated by using stabilized NA probes of non-circulating subtypes. We found that NCS mAbs recognized multiple NAs of influenza A as well as influenza B NAs and conferred prophylactic protections in mice against H1N1, H5N1, and influenza B viruses. Cryo-electron microscopy structures of two NCS mAbs revealed that they rely on structural mimicry of sialic acid, the substrate of NA, by coordinating not only amino acid side chains but also water molecules, enabling inhibition of NA activity across multiple influenza A and B viruses, including avian influenza clade 2.3.4.4b H5N1 viruses. Our results provide a molecular basis for the broad reactivity and inhibitory activity of NCS mAbs targeting the catalytic site of NA through substrate mimicry.


Conflict of interest statement

Competing interests: J.L., D.E., B.S.G., N.P.K., and M.K. are named inventors of a patent application describing engineered influenza neuraminidase antigens under publication number WO/2021/178621 filed by the University of Washington and the Department of Health and Human Services, USA. The remaining authors declare no competing interests.

Figures

Fig. 1
Fig. 1. Characterization of NA catalytic site targeting antibodies.
a Schematic model of influenza NA with its surface conservation across a single protomer. b Expanded B cell clones among sorted N4/N5-specific B cells. Each pie slice indicates a B cell clone with the same VH and VK/VL gene usage and similar CDRH3 sequence. The total number of paired heavy- and light-chain sequences analyzed is shown inside each pie chart. Light purple pie slices indicate the expanded NCS.1.x clone. c Heat map of mAb binding to recombinant influenza A NAs of group 1, group 2, and influenza B NAs by ELISA. WT and sNAp refer to wild-type and stabilized NA proteins, respectively. D25 (anti-respiratory syncytial virus mAb) was used as a negative control. d NA-binding of NCS.1.x mAbs measured by BLI. Binding was measured with recombinant NA and purified IgG. e Sequence alignment of immunoglobulin light- and heavy chain of NCS.1.x to their germline sequence (Kabat numbering). f 2D class averages of N1 CA09 sNAp alone (apo) and in complex with NCS.1.1 (top, scale bar: 80 Å). Representative region from a raw micrograph of NCS.1.1 bound to N1 CA09 sNAp (bottom left, scale bar: 240 Å). nsEM 3D reconstruction of the NCS.1.1–N1 CA09 sNAp complex (bottom right). Experiments were performed twice with similar results and results displayed from a representative experiment. Source data are provided as a Source Data file.
Fig. 2
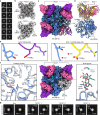
Fig. 2. cryoEM analysis of NCS.1.1 recognition of the NA catalytic pocket.
a 2D class averages of NCS.1.1 bound to N1-CA09-sNAp-155 showing four fabs bound to all particles. Scale bar, 180 Å. b 2.29 Å cryoEM reconstruction depicting the binding of NA-CA09-sNAp-155 to four copies of NCS.1.1. c Ribbon diagram illustrating the interaction of NCS.1.1 with a single protomer of N1-CA09-sNAp-155, with highlighted Ca2+, glycans, and H2O molecules. d Close-up view of NCS.1.1 CDRH3 with water molecules (red spheres). eg Comparative analysis of the binding footprints of NCS.1.1 (e), FNI9 (PDB: 8G3P) (f), and 1G01 (PDB: 6Q23)(g). h Comparison of CDRH3 binding motifs for embedding into the NA catalytic pocket for NCS.1.1, FNI9, and 1G01.
Fig. 3
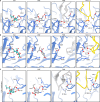
Fig. 3. Sialic acid receptor mimicry by NCS.1.1 is facilitated by a convergent evolutionary strategy.
ac Comparative examination of the binding modes of sialic acid (SIA), Oseltamivir (OSE), antibodies FNI9, and NCS.1.1. Close up views of regions surrounding R118NA, R292NA, and R371NA (a), E277NA (b), and D151NA and R152NA (c).
Fig. 4
Fig. 4. Water-mediated adaptations in NCS.1-like mAb recognition enable broad targeting of structurally conserved NA epitopes across group 1 antigens.
a 2D class averages of NCS.1 bound to WT N5 DB16. Scale bar, 180 Å. b CryoEM 3D reconstructions showing two populations in the dataset: one with all four binding sites occupied, and one with three binding sites occupied. c 3.36 Å cryoEM reconstruction illustrating the binding of WT N5 DB16 to four copies of NCS.1. d Ribbon diagram highlighting similarities in binding between NCS.1.1/N1 and NCS.1/N5. e Structural comparison of NCS.1/N5 and NCS.1.1/N1. f Analysis of the 4.1 Å three-Fab bound map of NCS.1 bound to N5. g nsEM 2D class averages of apo, NCS.1.1-, NCS.1.2-, and NCS.1.3-bound NA of B/Vic CO17. Scale bars, 170 Å.
Fig. 5
Fig. 5. In vitro characterization of NCS mAbs.
a NAI activity of the mAbs against viruses encompassing N1 NA measured by IRINA. H1N1 NY00, H1N1 CA09, H1N1 MI15 and H5N1 VN04 reporter influenza viruses were used. Data are plotted as mean ± SD of n = 4 individual wells at each dilution. b NAI activity of the mAbs against H2N2 and influenza B viruses. H2N2 SG57, B/Vic CO17, B/Vic MA04 reporter influenza viruses were used. Data are plotted as mean ± SD of n = 4 individual wells at each dilution. c NAI activity of the mAbs measured by ELLA with H1N1 CA09 reporter influenza virus. Data are plotted as mean of n = 2 individual wells at each dilution. d NAI activity of the mAbs measured by ELLA and NA-Fluor assay with B/Vic MA04 wild-type influenza virus. Data are plotted for each dilution. e, f NAI activity of the mAbs against clades 2.3.4.4b, 2.3.2.1a and 2.3.2.1e H5N1 reporter influenza viruses measured by IRINA (e) and ELLA (f). H5N1 CH23, H5N1 TX24, H5N1 Vic24 and H5N1 Cam23 reporter viruses were used. Data are plotted as mean ± SD of n = 4 individual wells (IRINA) and as mean of n = 2 (ELLA) at each dilution. g Viral growth inhibitory activity of the mAbs against H1N1 CA09, H5N1 VN04, H5N1 CH23, H5N1 TX24 and H5N1 Vic24 reporter influenza viruses. The half-maximal inhibitory concentration (IC50) of mAb for each virus is shown. n = 4 individual wells at each dilution. h NAI activity of the mAbs measured by NA-Fluor assay with recombinant NA N5 DB16 protein. Data are plotted as mean of n = 2 individual wells at each dilution. All experiments were performed once including appropriate controls. Source data are provided as a Source Data file.
Fig. 6
Fig. 6. In vivo protection by NCS.1, NCS.1.1 and NCS.1.3.
a Pre-exposure prophylaxis experiment in a murine model. be BALB/c mice (n = 8–10 per group) were administered 10 mg kg-1 of mAbs intraperitoneally 24 h prior to intranasal viral challenge. Virus dose was 15 × LD50 for H1N1 CA09 (b), >10 × LD50 for B/Vic MA04 (c), 6 × LD50 for H5N1 VN04 (d), and 3.5 × LD50 for H5N1 TX24 (e). The upper panels show Kaplan–Meier survival curves, and the lower panels show percent body weight loss (data are plotted as mean ± SD). For the H1N1 CA09 and H5N1 VN04 challenges, VRC01 served as the negative control and 315-02-1H01 as the positive control. In the B/Vic MA04 challenge, PGT121 and mAb47 were used as negative and positive controls, respectively. For the H5N1 TX24 challenge, VRC01 and MEDI8852 were used as negative and positive controls, respectively. All challenge experiments were performed once. Statistical analyses of Kaplan–Meier curve comparisons are shown in Supplementary Table 2. Source data are provided as a Source Data file. Mouse and syringe icons were generated using BioRender.

Update of

References

    1. Hu, X. et al. Highly pathogenic avian influenza a (H5N1) clade 2.3.4.4b virus detected in dairy cattle. bioRxiv30, 1335–1343 (2024). - PMC - PubMed
    1. Peacock, T. et al. The global H5N1 influenza panzootic in mammals. Nature637, 304–313 (2025). - PubMed
    1. Halwe, N. J. et al. H5N1 clade 2.3.4.4b dynamics in experimentally infected calves and cows. Nature637, 903–912 (2025). - PMC - PubMed
    1. Neumann, G. & Kawaoka, Y. Highly pathogenic H5N1 avian influenza virus outbreak in cattle: the knowns and unknowns. Nat. Rev. Microbiol.22, 525–526 (2024). - PubMed
    1. Eisfeld, A. J. et al. Pathogenicity and transmissibility of bovine H5N1 influenza virus. Nature633, 426–432 (2024). - PMC - PubMed

MeSH terms

LinkOut - more resources