. 2025 Sep;44(18):5037-5065.
doi: 10.1038/s44318-025-00520-2. Epub 2025 Aug 1.

NRAC controls CD36-mediated fatty acid uptake in adipocytes and lipid clearance in vivo

Affiliations

NRAC controls CD36-mediated fatty acid uptake in adipocytes and lipid clearance in vivo

Inderjeet Singh et al. EMBO J. 2025 Sep.

Abstract

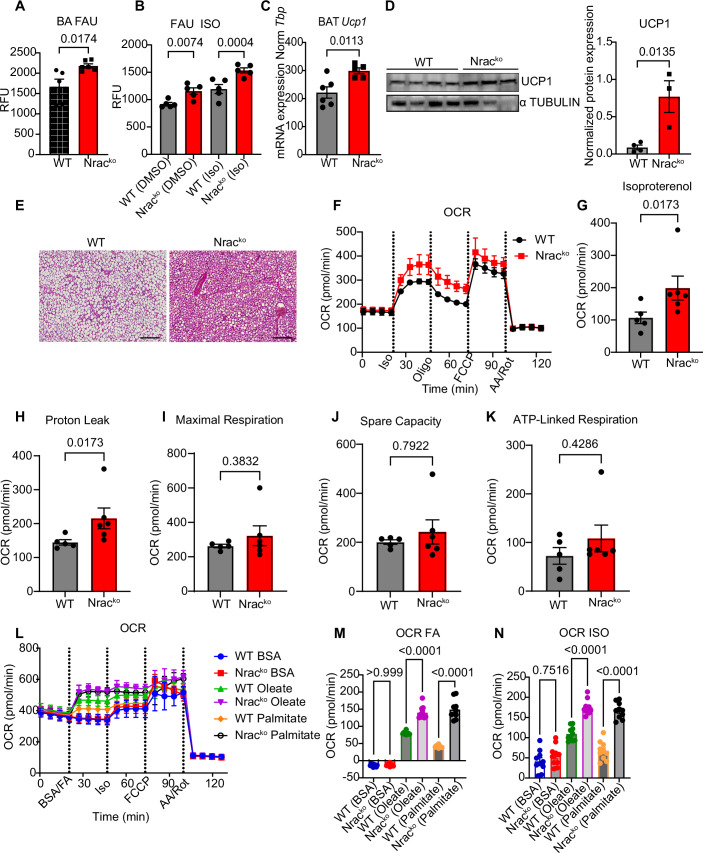
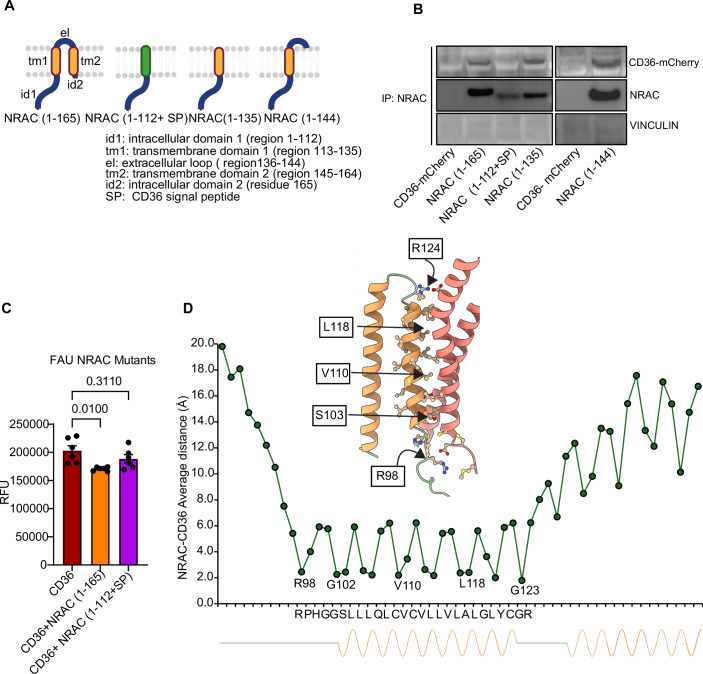
Adipose tissue is a central organiser of systemic lipid homeostasis and a pharmacological target in obesity, orchestrating cellular responses to environmental cues. Nutritionally regulated adipose and cardiac enriched protein (NRAC) is a small adipocyte-specific transmembrane protein with unknown function. Here, we show that Nrac directly interacts with scavenger receptor CD36 via its first transmembrane domain. Forming a complex with CD36 and caveolin-1 under low extracellular fatty acid (FA) concentrations, NRAC modulates CD36-dependent fatty acid uptake in adipocytes. Upon increase in extracellular FA levels, NRAC is ubiquitinated and internalised, leading to CD36's dissociation from caveolin-1 and clathrin-mediated endocytosis. This results in increased fatty acid uptake into fat cells, adipocyte hypertrophy, increased fat mass and elevated lipid clearance from the blood in chow-diet-fed mice. Finally, human NRAC expression and the intronic SNP rs12878589 are associated with body fat distribution and obesity. Together, these findings reveal a novel regulatory mechanism by which adipocytes sense and respond to extracellular fatty acid availability to fine-tune lipid uptake and storage at cellular and organismal level.

Keywords: Adipose Tissue; CD36; Clathrin-mediated Endocytosis; Fatty Acid Uptake; Hypertrophy.


Conflict of interest statement

Disclosure and competing interests statement. MB received honoraria as a consultant and speaker from Amgen, AstraZeneca, Bayer, Boehringer-Ingelheim, Lilly, Novo Nordisk, Novartis, and Sanofi. All other authors declare no conflict of interest. The funders had no role in the design of the study; in the collection, analyses, or interpretation of data; in the writing of the manuscript; or in the decision to publish the results.

Figures

Figure 1
Figure 1. NRAC deletion promotes adipocyte fatty acid uptake in chow diet-fed male mice.
(A) mRNA expression of Nrac in BAT, PGF and SCF tissues (n = 7 wt, 5 ko). (B) Body weight (n = 9 wt, 5 ko). (C) Fat mass (n = 9 wt, 5 ko, Age 15 weeks). Tissue weight of (D) PGF and (E) SCF (n = 6 wt, 8 ko, age 23 weeks). (F) Lean mass (n = 9 wt, 5 ko, Age 15 weeks). (G) H&E staining of PGF and SCF (age 23 weeks) (scale bar 200 µm)(H) Quantification of adipocyte cell sizes. (I, J) Fatty acid uptake (FAU) in the primary isolated adipocytes from (I) SCF and (J) PGF of male mice (n = 5 wt, 6 ko, age 12 weeks). (K) Fatty acid uptake in stably NRAC overexpressing (OE) wt and Nracko adipocytes. Scr plasmid was used as control. (L) Serum Triglyceride (TG) levels of 23 weeks old mice (n = 8 wt, 7 ko). (M) Lipid tolerance test (LTT) (n = 9 wt, 7 ko) (age 14 weeks) and, (N) baseline corrected area under the curve (AUC), (O) Lipid tolerance test in chow diet fed female mice (n = 4 wt. 4ko). Fatty acid uptake in primary (P) subcutaneous adipocytes (SCA) and (Q) perigonadal adipocytes (PGA) isolated from female mice (n = 4 wt, 4ko). (R) Oil red O staining on the primary differentiated subcutaneous adipocytes (scale bar 200 µm). Data are represented as mean ± SEM. *P < 0.05, **P < 0.01, ***P < 0.001 by Student’s t test or one or two-way ANOVA was used. Source data are available online for this figure.
Figure 2
Figure 2. NRAC deletion increases UCP1 in BAT and oxygen consumption rates in brown adipocytes.
(A) Fatty acid uptake (FAU) in primary mature brown adipocytes (BA) (n = 5 wt, 6 ko, age 12 weeks). (B) FAU in differentiated brown adipocytes, treated with either DMSO or 5 µM isoproterenol for 20 min (n = 5). (C) Ucp1 mRNA (n = 6 wt, 8 ko) and (D) protein expression (n = 4 wt and 3 ko) and quantification. (E) H&E staining of BAT (age 23 weeks) (scale bar 200 µm). (F) Oxygen consumption rate (OCR) in primary differentiated mature brown adipocytes (Iso Isoproterenol, Oligo Oligomycin, FCCP Carbonyl cyanide-4 (trifluoromethoxy), AA Antimycin A, Rot Rotenone), (G) OCR after isoproterenol injection (H) proton leak and (I) maximal respiratory capacity (J) spare capacity, (K) ATP-linked respiration (n = 5 wt, 6 ko, age 12 weeks). (L) Oxygen consumption rate in the differentiated adipocytes from wt and Nracko cells. BSA conjugated oleate and palmitate (100 µM) were injected in the first port, Isoproterenol (Iso) in the second port, FCCP (Carbonyl cyanide-4 (trifluoromethoxy) in 3rd port and AA (Antimycin A) and Rot (Rotenone) in the 4th port. (M) OCR calculated after subtracting fatty acid (FA) stimulated values from basal and (N) isoproterenol (Iso) stimulated OCR from basal (n = 10). Data are shown as mean ± SEM. *P < 0.05, **P < 0.01, ***P < 0.001 by Student’s t test in all figures except (E) where two-way ANOVA was used. Data on figure G-K were analyzed via Mann–Mann-Whitney U test as data were not normally distributed. Source data are available online for this figure.
Figure 3
Figure 3. NRAC regulates CD36/ caveolin-1 interaction and CD36 internalization.
(A) Mass spectrometry analysis of immunoprecipitated samples from PGF of wt and Nracko mice (n = 4). Proteins present in at least two wt samples, a wt to ko ratio >2 and an adjusted P value < 0.05 were blotted. The significance threshold was set at log2 fold change above 1 and -log10(P value) above 2. Significantly up-regulated proteins are shown in red. (B) Co-immunoprecipitation of NRAC with CD36 and CAVEOLIN-1 (CAV1). (C) Immunostaining of primary differentiated mature adipocytes either vehicle (0.05% ethanol) or Chlorpromazine (CPZ) (10 μM) treated for 1 h (scale 25 µm). (D) Co-immunoprecipitation of CD36 and CAV-1 from differentiated adipocytes. Co-immunoprecipitation of CD36 and CAV-1 from PGF (E), SCF (F) and BAT (G) of male mice. Source data are available online for this figure.
Figure 4
Figure 4. First transmembrane domain of NRAC is required for its association with CD36.
(A) Cartoon of full-length NRAC and various constructs from mouse NRAC. (B) Co-immunoprecipitation of NRAC and CD36. NRAC constructs and CD36-mCherry were cotransfected and IP was performed using our NRAC antibody. (C) Fatty acid uptake assay in HEK293T cells transfected with either CD36-mCherry alone or co-transfected with NRAC (1–165) and NRAC (1–112 + SP) (n = 6). (D) The average minimum distance between NRAC residues and CD36 residue was calculated over 500 ns of molecular dynamics simulation. A structural representation of the interaction surface is shown on the top. The first NRAC residue observed to interact with CD36 is R98, located within the intrinsically disordered region (IDR). The first helical interaction begins at G102 and extends to G123, with R124 exhibiting borderline interaction behavior. Data in (C) are shown as mean ± SEM. *P < 0.05, **P < 0.01, ***P < 0.001 by one-way ANOVA. Source data are available online for this figure.
Figure 5
Figure 5. A high fatty acid environment redirects CD36 to clathrin-mediated endocytosis in adipocytes.
(A) Lipid tolerance test and area under the curve in mice fed high fat diet (n = 7 wt, 7 ko, Age 16 weeks, 10 weeks on HFD), (B) serum triglyceride levels (17 weeks on HFD) (n = 8 wt, 7 ko). (C, D) Body composition (13 weeks on HFD). Fatty acid uptake (FAU) assay in primary mature adipocytes from (E) PGF and (F) SCF (n = 6 wt, 7 ko). Adipocytes were either treated with BSA or 100 µM oleate. (G) Immunostaining of differentiated adipocytes treated either with oleate (100 µM, 24 h) and ethanol (0.05%, 1 h) or with oleate (100 µM, 24 h) and CPZ (10 µM, 1 h) (scale bar 25 µm). (H) Immunostaining for NRAC and perlipin-1 (PLIN1) on PGF from chow diet (age 23 weeks) and HFD fed male mice (age 23 weeks, 17 weeks on HFD). Scale bar 25 µm. (I) Immunoprecipitation of Ubiquitin-HA. HEK293T cells were transfected with either NRAC or with NRAC + Ubiquitin-HA (Ub-HA) plasmids and treated with with BSA + MG132 (50 µM) or Oleate (100 µM) + MG132 (50 µM) for 1 h. Data are shown as mean ± SEM. *P < 0.05, **P < 0.01, ***P < 0.001 by Student’s t test or one or two-way ANOVA. Source data are available online for this figure.
Figure EV1
Figure EV1. NRAC deletion does not affect glucose metabolism or insulin sensitivity in chow diet fed mice.
Validation of NRAC antibody by (A) western blotting of HEK293T cells transfected with either NRAC-GFP or GFP plasmids. Untransfected cells were used as control. (B)Western blotting to detect endogenous NRAC in BAT, SCF and PGF and (C) immunostaining of subcutaneous differentiated mature adipocytes to detect endogenous NRAC (scale bar 10 µm), and (D) Immunoprecipitation of NRAC from perigonadal fat (PGF). (EH) mRNA expression of Tnfa and Il6 in PGF and SCF of male mice (n = 6 wt, 5ko), (I) weights of liver, heart and pancreas (n = 9 wt, 5ko). (J) Glucose tolerance test and area under the curve (age 8 weeks). (K) Insulin tolerance test (ITT) and area under the curve (AUC) in 9 weeks old male mice. (L) Percentage of HbA1c in 12-week-old male mice. (M) Body weight development of chow diet fed female wt and Nracko mice. (N) Fat and (O) lean mass of 15-week-old chow diet fed female mice. (P) Glucose tolerance test and area under the curve of 8 weeks old female mice. (Q) %HbA1c in 12-week-old female mice. (R) Insulin tolerance test (ITT) and area under the curve (AUC) in 9-week-old female mice. (S) H&E staining of SCF and PGF tissues of female mice (Age 23 weeks), and (T) quantification of lipid droplets. n = 9wt and 7ko for males and 5wt and 7ko for females. (U) mRNA expression of Nrac from BAT, SCF and PGF of male and female mice (n = 4). Data are shown as mean ± SEM. *P < 0.05, **P < 0.01, ***P < 0.001 by Student’s t test or one or two-way ANOVA. Source data are available online for this figure.
Figure EV2
Figure EV2. NRAC deletion does not affect energy homeostasis, food intake and substrate utilization in mice under chow diet.
(A) Oxygen consumption rates (OCR) in wt and Nracko differentiated adipocytes. Injection strategy included BSA or BSA conjugated oleate and palmitate (100 µM each) (port 1), oligomycin (port 2), FCCP (port 3) and Antimycin A and rotenone in port 4. (B) OCR calculated by subtracting OCR after fatty acid (FA) stimulation from basal respiration. (C) Proton leak calculated by subtracting oligomycin OCR from non-mitochondrial OCR (n = 9). (D) Immunostaining of BAT from wt mice either overnight starved (16 h), random fed, acute cold, (4 h) and CL-316243 injected mice (n = 3), age 12 weeks (scale 100 µm). (E) Basal metabolic rate (BMR). (F) Energy expenditure and respiratory exchange ratio (RER), (G, H) in saline treated mice, (I, J) in CL316243 treated mice and (K, L) upon acute cold exposure (n = 6 WT and 8KO, Age 16 weeks). Data are shown as mean ± SEM. *P < 0.05, **P < 0.01, ***P < 0.001 by Student’s t test or one or two way ANOVA. In figures (EG, I, K) the data are plotted as linear regression. Source data are available online for this figure.
Figure EV3
Figure EV3. NRAC regulates CD36/Cav1 interaction in adipocytes.
(A) Immunoprecipitation of NRAC from BAT and SCF. (B) Immunostaining of differentiated immortalized preadipocytes treated with vehicle (0.05% ethanol) or Chlorpromazine (CPZ) (10 μM) for 1 h (scale 25 µm). Source data are available online for this figure.
Figure EV4
Figure EV4. First transmembrane domain of NRAC is required for NRAC-CD36 interaction.
(A) MD-simulations of human NRAC and CD36. The full simulation block is shown, with the central grey stripe representing the lipid bilayer membrane. Water molecules are depicted as red and white particles, while Na⁺ and Cl ions appear as pink spheres at a physiological concentration of 0.15 M. The bright green structures correspond to the proteins CD36 and NRAC, with CD36 embedded in the upper membrane leaflet and NRAC in the lower leaflet, and the zoomed in area of the same region. (B) CD36–NRAC complex is embedded in the membrane, with CD36 located on top and NRAC below. The membrane is shown in grey. (C) The CD36–NRAC complex is embedded in the membrane, with CD36 on top and NRAC below. Phospholipids in the membrane are represented as grey circles. Source data are available online for this figure.
Figure EV5
Figure EV5. HFD feeding does not affect glucose metabolism, insulin sensitivity and plasma profile of inflammatory cytokines in Nracko mice.
(A) Glucose tolerance test and baseline corrected area under the curve (n = 9 wt, 7 ko, 10 weeks on HFD). (B) Percentage of HbA1c in mice13 weeks on HFD (n = 9 wt, 7 ko). (C) Insulin tolerance test and baseline corrected area under the curve, (12 weeks on HFD, n = 9 wt, 7 ko). (D) H&E staining of livers of HFD fed mice (17 weeks on HFD), (E) Liver triglyceride levels and (F) liver weight (n = 9 wt, 7 ko, 17 weeks on HFD), Plasma levels of (G) TNFα, (H) IL6, (I) Leptin, and (J) FGF21 in male and female non-fasted mice (male: 14 wt, 13 ko; female: 13 wt, 15 ko, 20 weeks on HFD). (K) Plasma lipoprotein profile (n = 5 wt, 5ko, 10 weeks on HFD), (L) Body weight development in HFD fed animals (n = 8 wt, 7 ko). Week 0 was the day when the diet was switched from chow to HFD (age 6 weeks). (M) H&E staining of PGF and SCF from HFD fed mice (17 weeks on HFD), and (N) the quantification of adipocyte cell size. Significance levels are indicated as follows: *P < 0.05, **P < 0.01, and ***P < 0.001. Data are shown as mean ± SEM. *P < 0.05, **P < 0.01, ***P < 0.001 by Student’s t test in all figures except (A, C, K, L) where two-way ANOVA was used. Source data are available online for this figure.
Figure EV6
Figure EV6. Fatty acid stimulation reduces NRAC surface localization in adipocytes.
(A) Immunostaining of differentiated subcutaneous adipocytes, treated with BSA, Oleate (100 µM) and palmitate (100 µM) for 5, 30 and 60 min. On day 8 of differentiation, cells were starved with serum free medium for 1 h and treated with fatty acids for the indicated times. (B) Immunostaining of differentiated subcutaneous adipocytes on day 8 of differentiation. Cells were starved with serum free medium 1 h and treated with 10, 100 and 200 µM BSA conjugated oleate. (C) Immunostaining of differentiated adipocytes treated either with oleate (100 µM) or with oleate (100 µM) and CPZ (10 µM) for one hour after 1 h serum starvation. Nrac mRNA expression in (D) subcutaneous (SCF) and (E) perigonadal (PGF) adipose tissue from CD and HFD fed mice (n = 5 CD and 4 HFD), (F) Nrac mRNA expression of sham and ovariectomized (OVR) HFD fed mice (n = 3 sham, 6 ovariectomized). (G) The correlation of C14orf180 (human NRAC) gene expression with clinical parameters was analyzed in both subcutaneous (SC) and visceral (VIS) adipose tissue across all individuals, as well as separately for male (M) and female (F) participants. Spearman correlations were calculated, and P values were adjusted for false discovery rate. Significance levels are indicated as follows: *P < 0.05, **P < 0.01, and ***P < 0.001. Data are shown as mean ± SEM. *P < 0.05, **P < 0.01, ***P < 0.001 by Student’s t test in all figures except (A, C, K, L) where two-way ANOVA was used. Source data are available online for this figure.

References

    1. Abraham MJ, Murtola T, Schulz R, Páll S, Smith JC, Hess B, Lindahl E (2015) GROMACS: high performance molecular simulations through multi-level parallelism from laptops to supercomputers. SoftwareX 1-2:19–25
    1. Ali AH, Mundi M, Koutsari C, Bernlohr DA, Jensen MD (2015) Adipose tissue free fatty acid storage in vivo: effects of insulin versus niacin as a control for suppression of lipolysis. Diabetes 64:2828–2835 - PMC - PubMed
    1. Bakker AH, Nijhuis J, Buurman WA, van Dielen FM, Greve JW (2006) Low number of omental preadipocytes with high leptin and low adiponectin secretion is associated with high fasting plasma glucose levels in obese subjects. Diab Obes Metab 8:585–588 - PubMed
    1. Bartelt A, Bruns OT, Reimer R, Hohenberg H, Ittrich H, Peldschus K, Kaul MG, Tromsdorf UI, Weller H, Waurisch C et al (2011) Brown adipose tissue activity controls triglyceride clearance. Nat Med 17:200–205 - PubMed
    1. Bluher M (2020) Metabolically healthy obesity. Endocr Rev 41:bnaa004 - PMC - PubMed

LinkOut - more resources