. 2025 Aug 1;16(1):583.
doi: 10.1038/s41419-025-07902-8.

Valproic acid improves the efficacy of oxaliplatin/fluoropyrimidine-based chemotherapy by targeting cancer stem cell via β-Catenin modulation in colorectal cancer

Affiliations

Valproic acid improves the efficacy of oxaliplatin/fluoropyrimidine-based chemotherapy by targeting cancer stem cell via β-Catenin modulation in colorectal cancer

Maria Serena Roca et al. Cell Death Dis. .

Abstract

Despite advances in systemic therapeutic approaches, metastatic colorectal cancer (mCRC) patients harboring BRAF or RAS mutations have poor outcomes. Cancer stem cells (CSCs) play central roles in drug resistance and CRC recurrence. Therefore, targeting the epigenetic mechanisms that sustain CSC properties is a promising therapeutic approach. In this study, we report the efficacy of a treatment strategy with the potential to overcome chemotherapy resistance that involves administering the well-known antiepileptic drug and epigenetic agent valproic acid (VPA) and the standard chemotherapy regimen of oxaliplatin/fluoropyrimidine to wild-type CSCs and CSCs with BRAF and RAS mutations in enriched primary spheroid cultures. Notably, we demonstrated that VPA plus chemotherapy was more effective than other epigenetic drug-chemotherapy combinations by inhibiting cell proliferation and clonogenic growth and by inducing apoptosis and DNA damage. Mechanistically, proteomic analysis demonstrated that VPA induced CSC differentiation through the critical target of VPA, β-Catenin. Indeed, VPA promoted the proteasome-dependent degradation of β-Catenin by enhancing its binding to the E2 ubiquitin-conjugating enzyme UBE2a, leading to marked reductions in nuclear and cytoplasmic β-Catenin levels and subsequently decreasing β-Catenin/TCF-LEF target promoter activation. These effects were confirmed in three in vivo CRC xenograft models, including a syngeneic CT26 immunocompetent mouse model, where VPA combined with oxaliplatin/capecitabine chemotherapy and anti-VEGF therapy, a standard first-line treatment for mCRC, significantly suppressed tumor growth and prolonged survival with minimal toxicity. Proteomic analysis of tumor tissues from in vivo CRC models confirmed the VPA-mediated downregulation of CSC markers and β-Catenin.


Conflict of interest statement

Competing interests: The authors declare no competing interests. Ethics approval and consent to participate: All methods were carried out in accordance with relevant guidelines and regulations. Sphere cells were kindly provided by the Stassi G Laboratory and isolated from CRC patients undergoing colon resection, in accordance with the ethical standards regarding Human Experimentation (authorization CE9/2015, Policlinico Paolo Giaccone, Palermo). Informed consent was obtained from all subjects involved in the study. All animal procedures were performed in accordance with ARRIVE guidelines [52] (European directive 2010/63/UE and Italian Law—Directive 2010/63/EU and DL 26/2014) and were approved by the appropriate institutional review board (no. 377/2018-PR).

Figures
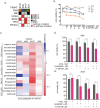
Fig. 1
Fig. 1. Antiproliferative effects of epigenetic compounds in combination with oxaliplatin/5′-DFUR in CSphCs.
a CSphC features such as the consensus molecular subtype (CMS), microsatellite instability status (MSI), and mutational status of the CRC driver genes KRAS, BRAF, TP53, and PIK3CA. b CSphCs#123, #8, #147, and #24 were treated for 96 h with increasing concentrations of OXA/5′-DFUR, after which cell viability was determined. c A small-scale combination drug screen was performed by treating CSphCs with 17 epigenetic compounds at a fixed dose plus the oxaliplatin/5′-DFUR at increasing dosages. The heatmap shows the ΔAUC (AUCepidrug+oxaliplatin/5′-DFUR-AUCoxalipl- atin/5′-DFUR) values for CSphCs#123, #8, #147, and #24; ΔAUC < 0 indicates an increase in the antiproliferative effect of chemotherapy. d, e CSphCs#8 and #147 were treated for 72 h with VPA (0.5 mM) and/or oxaliplatin (50 μM) and/or 5′-DFUR (1 μM). Cell viability, expressed as a percentage of the control, was assessed by the CellTiter-Glo 3D® Luminescent Assay (see “Materials and Methods”). Significant differences according to a t-test are reported (**** indicates P < 0.0001, *** indicates P < 0.005).
Fig. 2
Fig. 2. VPA affects innate stem cell properties and induces a differentiation-like phenotype.
a, b A total of 4000 CSphCs#08 per ml were plated in Matrigel (70%), and after 24 h, VPA (0.5 and 1 mM) was added for 24 h. Next, 72 photographs were captured of each well, and quantitative and qualitative analyses were performed with Opera Phoenix HTS and Harmony software. c Phase‒contrast analysis of CSphC#8 grown in Matrigel and treated as indicated for 2 days. One representative of four independent experiments carried out with CSphC#8 is shown. Scale bars, 200 μm. d Immunohistochemical analysis of CK20 and Lgr5 in CSphC#8 growing in Matrigel for 24 h and treated for 16 h with 0.5 mM VPA. Scale bar, 200 μm. e Evaluation of the mRNA expression of the differentiation marker cytokeratin 20 (CK20) and stem cell markers (Lgr5, Survivin, and Axin2) upon VPA treatment (0.5 mM, 16 h). f Full proteome identification via LC‒MS/MS technology was performed as schematically reported. g Heatmap showing the 515 proteins with similar changes in expression level in CSphC#08 upon VPA treatment under differentiation-induced conditions (10% FBS) compared with that in untreated CSphC#08. The criteria were a P value less than 0.05 and a fold change of less than +1 or −1 in one experimental group. The colorimetric scale is fixed at +5 and −5. The 15 boxes highlighted in the heatmap represent previously established stem cell-associated genes. h Gene–gene network generated by IPA starting from the 515 differentially expressed proteins. The central hierarchical dominant hub in the network was β-Catenin, and the main canonical pathway was Wnt/β-Catenin signaling. i The top ten upstream transcription regulators of the 515-gene set are reported, with β-Catenin as the most significant regulator. The Ingenuity® Pathway Analysis network legend can be accessed at http://qiagen.force.com/KnowledgeBase/articles/ Basic_Technical_Q_A/Legend. Significant differences according to a t-test are reported (*** indicates P < 0.0001, ** indicates P < 0.001, * indicates P < 0.05).
Fig. 3
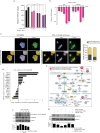
Fig. 3. VPA modulates the Wnt signaling pathway and β-catenin expression.
a CSphC#147 were treated with VPA (0.5, 1, or 2 mM) alone or with 25 ng/μl wnt3a for 24 h, and TCF/LEF luciferase reporter activity was evaluated with a dual luciferase kit. The error bars represent the standard errors of the mean (SEMs) (n = 4); the reported data are representative of three independent experiments. b CSphC #147 was treated with VPA (0.5 mM) for the indicated durations, after which the cells were fixed and stained with βCatenin-Alexa 594. Cellular and nuclear β-Catenin protein expression was measured with Harmony software. c Representative overview confocal images displaying β-Catenin expression, F-actin fibers (stained with phalloidin-FITC) and nuclei (stained with DAPI) in CSphC#08 that were untreated or treated with 0.5 mM VPA; magnification, 40×. Scale bar: 50 μm and inset magnification 80×. β-Catenin nuclear intensity quantified by Harmony software for each cell in each spheroid and then clustered into β-Catenin low-expression nuclei and β-Catenin high-expression nuclei considering the average β-Catenin intensity in each spheroid. The error bars represent the SEMs (spheroids n = 30); the reported data are representative of three independent experiments. d Proteins involved in WNT/β-Catenin signaling identified via label-free MS/MS upon IP of β-Catenin starting from 500 ng of total protein lysate and identified by IPA software (Mascot score > 50, at least one unique peptide with a P value < 0.05). The fold change of mascot score represents the presence of proteins in VPA-treated versus untreated CSphC#08. e A representative WNT/β-Catenin signaling pathway where the β-Catenin interactors reported in the protein list in d are shown in green, red, and orange. f β-Catenin phosphorylation and expression in CSphC#08 treated with VPA (0.5 mM) and collected after 1, 2, 4, and 6 h. β-Actin served as a loading control. The graph at the bottom shows the expression of phospho-β-Catenin normalized to that of β-Catenin and β-actin. g β-Catenin protein expression in CSphC#08 treated with VPA (0.5 mM) and/or bortezomib (10 mM) and/or mg132 (5 μM) for 6 h. β-actin served as a loading control. The graph at the top shows the fold change in expression compared with that in the untreated sample. Significant differences according to a t-test are reported (*** indicates P < 0.0001, ** indicates P < 0.001, * indicates P < 0.05).
Fig. 4
Fig. 4. VPA potentiates the antitumor effects of oxaliplatin/5′-DFUR.
CSphCs were treated with 0.5 mM VPA, 100 nM oxaliplatin, and 4 μM 5′-DFUR. a Limiting dilution assay performed on CSphC#08 without or with 24 h of treatment with VPA plus oxaliplatin and 5′-DFUR plated in ultralow attachment 96-well plates without additional treatment for three weeks. Clonal frequency was evaluated with the extreme limiting dilution analysis limdil function as described in the “Materials and Methods” section. b Apoptosis was evaluated by a Caspase 3/7 activity assay in CSphC #08 treated as previously described. c, d DNA damage was analyzed in CSphC #08 by visualizing foci of the double-strand break marker γH2AX. CSphCs were treated for 24 h with or without VPA and oxaliplatin/5′-DFUR. CSphCs were stained for γH2AX (orange), and DAPI was used to stain the nuclei (blue) before Opera Phenix HTS microscopy measurements. The number of spots for each cell was analyzed by Harmony software. Representative images showing γH2AX-positive nuclear foci at 40× magnification and insert magnification 80×. Significant differences according to the t-test are reported (*** indicates P < 0.0001, ** indicates P < 0.001, * indicates P < 0.05). e β-Catenin, pATM, ATM, pp53(ser37), p53, RAD51, BAX, VDAC-1, and GPX4 protein expression and cleaved caspase 3 levels in CSphC #147 treated with VPA alone or in combination with chemotherapeutics for 24 h. β-Actin served as a loading control. The data shown are representative of three independent experiments. f The healthy colon cell CDD18co were treated for 72 h with VPA (0.5 mM) and/or oxaliplatin (50 μM) and/or 5′-DFUR (1 μM). Cell viability, expressed as a percentage of the control, was assessed by the CellTiter-Glo 3D® Luminescent Assay (see “Materials and Methods”). Significant differences according to the t-test are reported (ns indicates P > 0.05).
Fig. 5
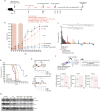
Fig. 5. In vivo synergistic antitumor effect of VPA plus CHT.
a Schematic of the in vivo xenograft experiment, including timeline and agent concentration. CSphC#08 was s.c. injected into athymic mice as described in the “Materials and Methods”. When the established tumors were palpable, the mice were treated as reported in the figure. The mice were sacrificed when the tumor volume became greater than 1500 mm3 and/or when a 20% reduction in weight was observed. b CSphC#08 tumor volume curves. The means ± SEMs are reported for each single or combination treatment at each time point. The statistically significant results are shown in black for the comparison of the untreated, VPA, CHT, and VPA + CHT groups and in red for the comparison of the untreated, VPA, CHT/anti-VEGF, and VPA + CHT/anti-VEGF groups. c A synergistic effect was observed after 1 treatment cycle, as shown by the waterfall plot of the fold change in tumor volume compared with the baseline (day 0, start of treatment) in the transplanted tumors. P values were calculated via a two-tailed, unpaired Student’s t-test. (*** indicates P < 0.0001, ** indicates P < 0.001, * indicates P < 0.05). d Kaplan–Meier curves comparing survival in the single and combination treatment groups. The number of mice per treatment condition is indicated. e Serum alanine aminotransferase (ALT) and aspartate aminotransferase (AST) levels were evaluated in 3 mice from each group at the end of two cycles of treatment. f Full proteome identification by LC‒MS/MS, starting from a 1 mm2 spot obtained from embedded untreated (n = 3) and VPA-treated (n = 2) tumor samples, as schematically noted. The normalized abundances of β-Catenin, CD44, and wnt3a are reported. g β-Catenin and oct-4 protein expression in CSphC #08 tumor tissues collected at the end of treatment. β-Actin served as a loading control.

References

    1. Siegel RL, Giaquinto AN, Jemal A. Cancer statistics, 2024. CA Cancer J Clin. 2024;74:12–49. - PubMed
    1. Cervantes A, Adam R, Rosello S, Arnold D, Normanno N, Taieb J, et al. Metastatic colorectal cancer: ESMO clinical practice guideline for diagnosis, treatment and follow-up. Ann Oncol. 2023;34:10–32. - PubMed
    1. Gmeiner WH. Recent advances in therapeutic strategies to improve colorectal cancer treatment. Cancers (Basel). 2024;16:1029. - PMC - PubMed
    1. Zhang Z, Ji J, Liu H. Drug repurposing in oncology: current evidence and future direction. Curr Med Chem. 2021;28:2175–94. - PubMed
    1. Roca MS, Di Gennaro E, Budillon A. Implication for cancer stem cells in solid cancer chemo-resistance: promising therapeutic strategies based on the use of HDAC inhibitors. J Clin Med. 2019;8. - PMC - PubMed

MeSH terms