. 2025 Aug 1;15(1):28105.
doi: 10.1038/s41598-025-08384-6.

High-selective HDAC6 inhibitor alleviates bone marrow fibrosis through inhibiting collagen formation and extracellular matrix deposition

Affiliations

High-selective HDAC6 inhibitor alleviates bone marrow fibrosis through inhibiting collagen formation and extracellular matrix deposition

Chiao-Hsu Ke et al. Sci Rep. .

Abstract

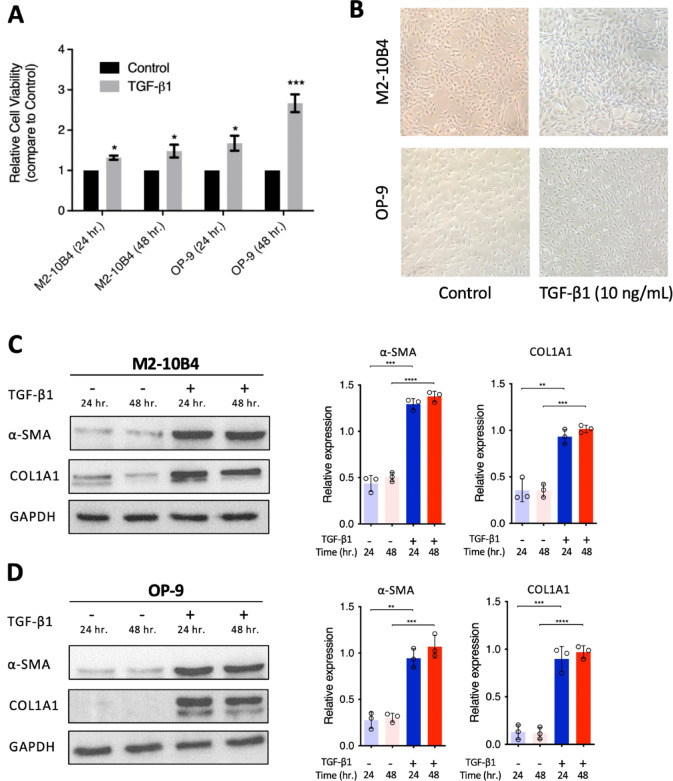
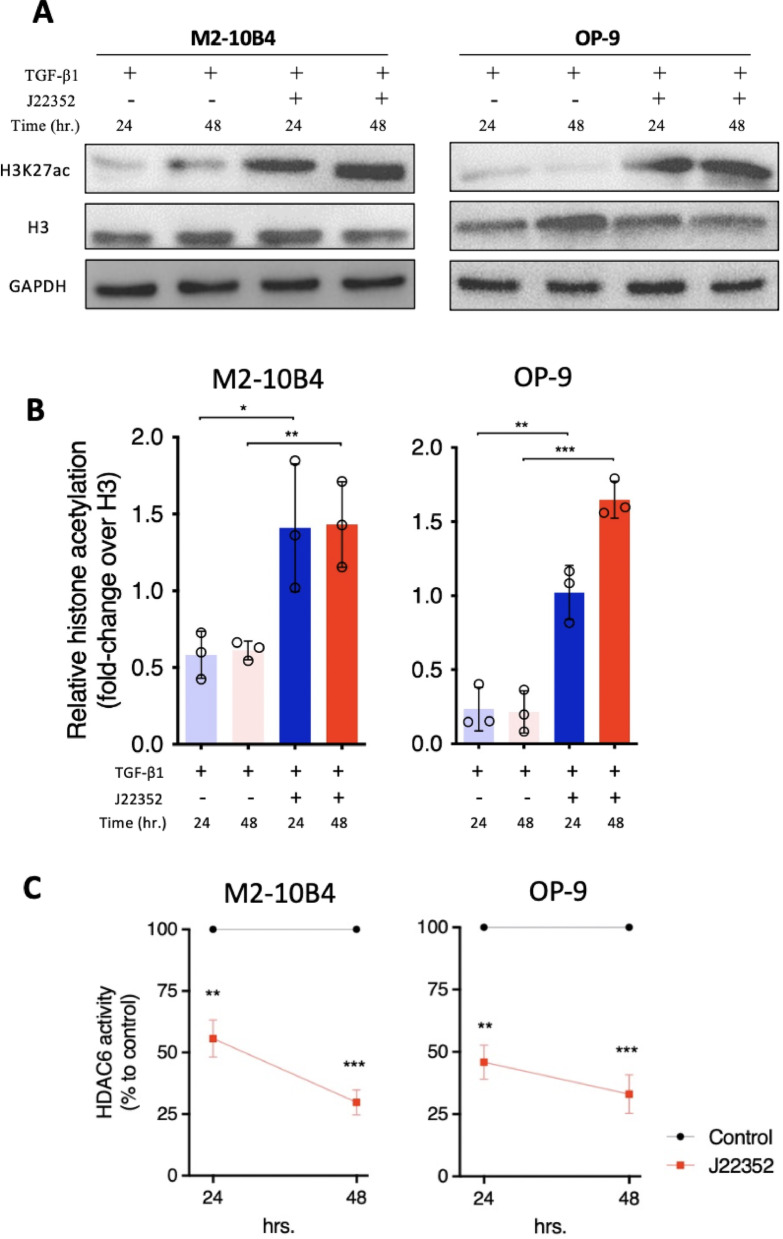
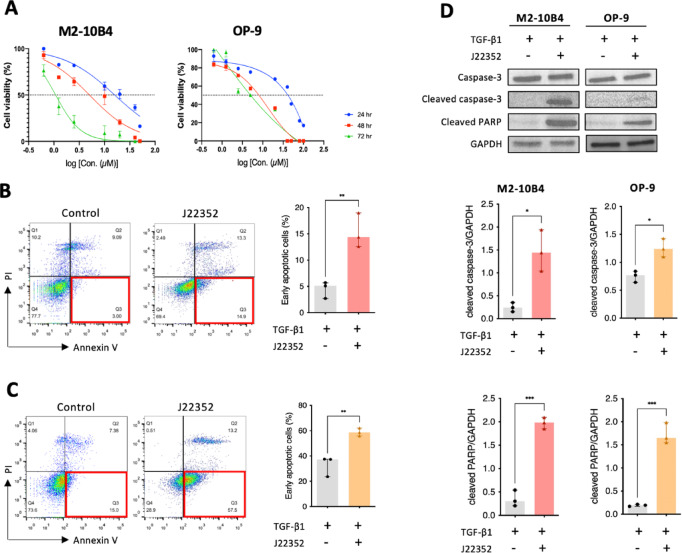
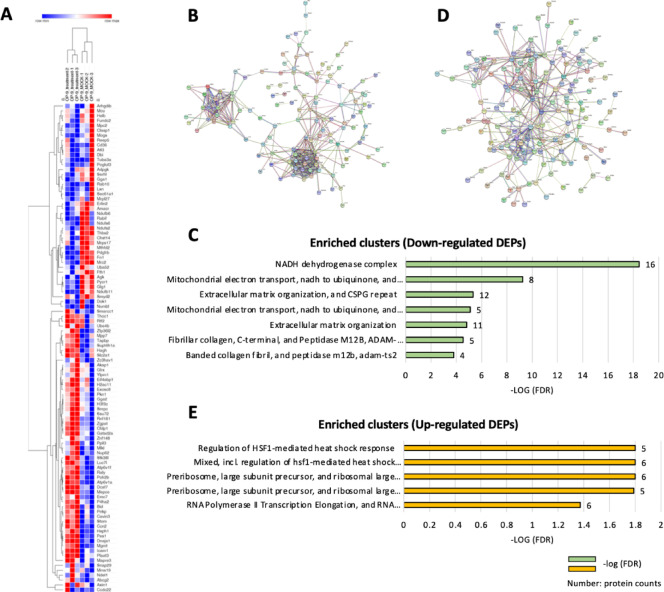
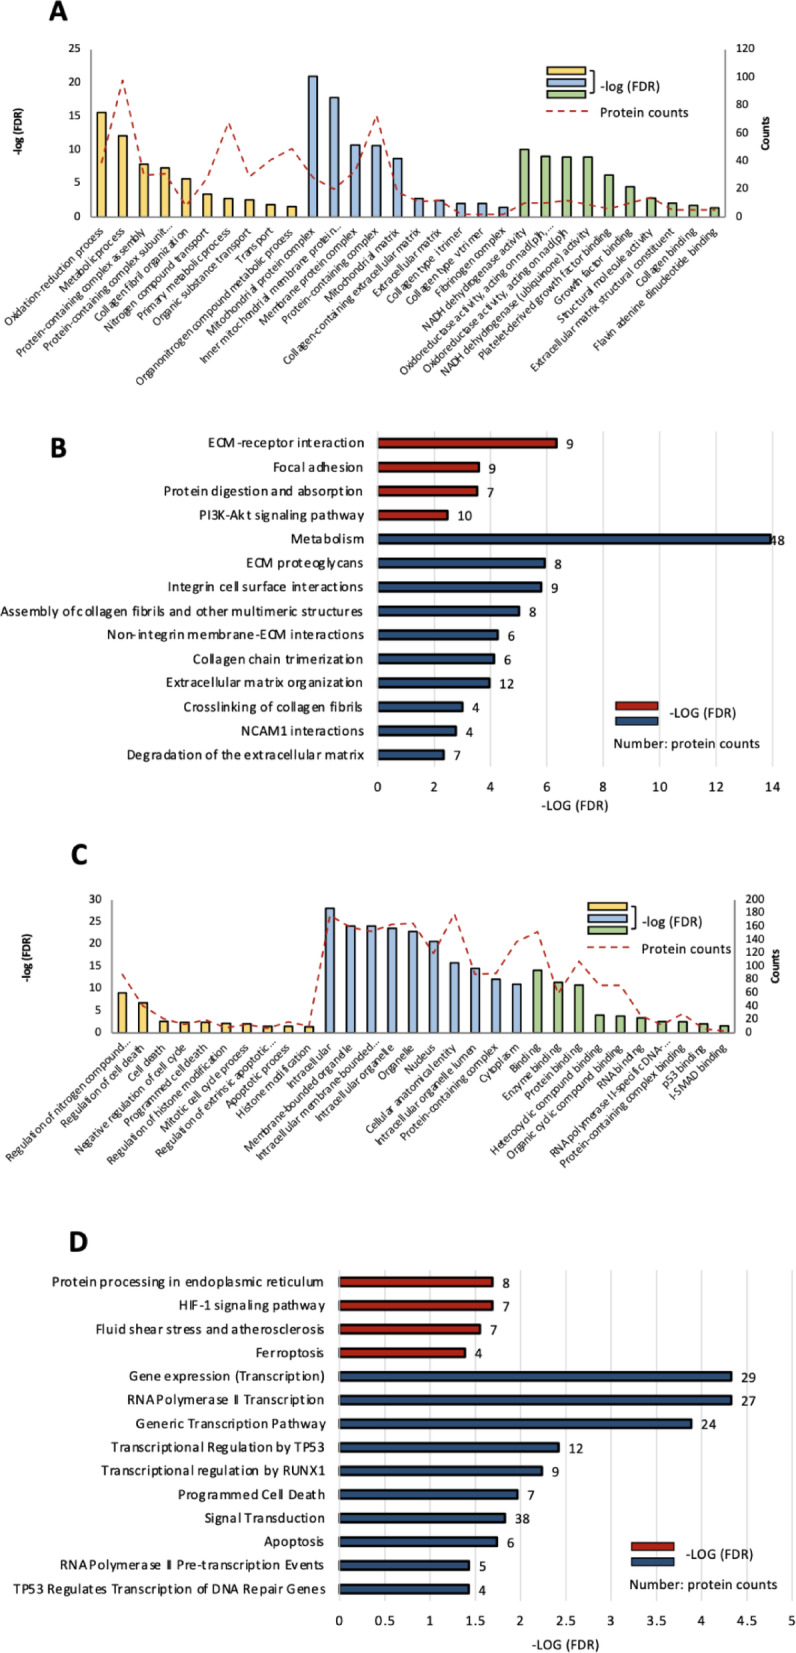
Bone marrow fibrosis (BMF) impairs normal hematopoietic functions in patients. The overactivation of the TGF-β signaling pathway is regarded as one of the offenders causing disease progression. Thus, factors capable of regulating TGF-β secretion hold great potential in reversing fibrotic diseases. One such factor is histone deacetylase inhibitors (HDACis), which can modulate the expression of TGF-β. Our previous study successfully synthesized a selective HDAC6 inhibitor, J22352, for pulmonary fibrosis; however, the treatment efficacies on BMF remain unclear. Therefore, in this study, we treated bone marrow-derived myofibroblasts with J22352. The results showed that J22352 significantly reduced cell viability, induced apoptosis, and inhibited extracellular matrix (ECM) accumulation. Liquid chromatography-tandem mass spectrometry (LC-MS/MS) analysis was employed to disclose potential mechanisms, identifying 334 differentially expressed proteins (DEPs). The DEPs were involved in cell apoptosis, programmed cell death, ECM deposition, and collagen formation. These results suggest that J22352 efficiently alleviated BMF by inducing cell apoptosis and inhibiting ECM deposition. This study introduces a novel selective HDAC6 inhibitor as a potential option for slowing down the progression of BMF. We aim to provide a promising selective HDACi for clinical medicine through a detailed analysis of its mechanisms and efficacy, offering new prospects in the field.

Keywords: Bone marrow fibrosis; Histone deacetylase inhibitor; Organ fibrosis; Transforming growth factor-β (TGF-β).


Conflict of interest statement

Declarations. Competing interests: The authors declare no competing interests.

Figures

Fig. 1
Fig. 1
TGF-β1 mediated proliferation and induced collagen deposition in BM-derived fibroblasts. (A) Cell proliferation in M2-10B4 and OP-9 cells with TGF-β1 (10 ng/mL) induction. (B) Representative figures show the cell growth in M2-10B4 and OP-9 cells induced by the TGF-β1 stimulation. (C) Representative western blot images and quantification in M2-10B4 and (D) OP-9 cells, showing the increased levels of α-SMA and COL1A1 triggered by TGF-β1. Bar graphs reflect mean ± SEM, and data were analyzed by the Student t-test. *P < 0.05; **P < 0.01; ***P < 0.001; ****P < 0.0001.
Fig. 2
Fig. 2
J22352 effectively increased histone acetylation and suppressed HDAC6 activity in BM-derived fibroblasts compared with non-treated control. (A) Representative figures of western blots. Histone modifications change following treatment with J22352 for 24 and 48 h. Nuclear extracts were subjected to immunoblots. (B) Densitometric analysis plots corresponding to western blot analysis. GAPDH was used as a loading control. H3K27ac values were then normalized to the H3. (C) Assessment of HDAC6 activity in BM-derived fibroblasts upon J22352 treatments for 24 and 48 h. Working concentrations of each cytokine and/or J22352 were described as followed. TGF-β1: 10 ng/mL; J22352: 15.83 and 5.02 µM for 24 and 48 h (M2-10B4 cells); J22352: 82.0 and 13.46 µM for 24 and 48 h (OP-9 cells). Data presented as mean ± SEM and analyzed by the Student t-test. *P < 0.05; **P < 0.01; ***P < 0.001.
Fig. 3
Fig. 3
The in-house synthesized HDAC6 selective inhibitor (J22352) induced early apoptosis in BM-derived fibroblasts. (A) The half-maximal inhibitory concentration (IC50) of J22352 in M2-10B4 and OP-9 cells. (B) Representative flow cytometric plots of M2-10B4 and (C) OP-9 cells are shown. Quadrants indicate viable cells (lower left quadrant), early apoptosis (lower right quadrant), late apoptosis (upper right quadrant), and necrotic cells (upper left quadrant). (D) Western blot analysis of the expression of apoptosis proteins, caspase-3, cleaved caspased-3, and cleaved PARP, in M2-10B4 and OP-9 cells. Working concentrations of each cytokine and/or J22352 were described as followed. TGF-β1: 10 ng/mL; J22352: 15.83 µM for 24 h (M2-10B4 cells); J22352: 82.0 µM for 24 h (OP-9 cells).Each bar reflects the mean ± SEM of three independent experiments. Data were analyzed by the Student t-test. **P < 0.01.
Fig. 4
Fig. 4
Downregulated expressions of collagen and ECM-related genes with J22352 treatments in BM-derived fibroblasts. (A) mRNA expressions of α-SMA, COL1A1, COL3A1, Fibronectin, (B) CTGF, Elastin, Periostin, and (C) MMP-9 in TGF-β1-induced M2-10B4 and OP-9 cells. Working concentrations of each cytokine and/or J22352 were described as followed. TGF-β1: 10 ng/mL; J22352: 15.83 and 5.02 µM for 24 and 48 h (M2-10B4 cells); J22352: 82.0 and 13.46 µM for 24 and 48 h (OP-9 cells). Data presented as median ± interquartile range and analyzed by the Mann-Whitney test. n.s., no significant difference; *P < 0.05; **P < 0.01; ***P < 0.001; ****P < 0.0001.
Fig. 5
Fig. 5
J22352 inhibited collagen formation, ECM deposition, and SMAD phosphorylation in BM-derived fibroblasts. (A) Representative western blot images and (B) quantification of α-SMA, COL1A1, COL3A1, CTGF, Elastin, Periostin, SMAD 2/3, and phosphorylated SMAD 2/3 expression in M2-10B4 and OP-9 cells. Working concentrations of each cytokine and/or J22352 were described as followed. TGF-β1: 10 ng/mL; J22352: 15.83 and 5.02 µM for 24 and 48 h (M2-10B4 cells); J22352: 82.0 and 13.46 µM for 24 and 48 h (OP-9 cells). Data presented as mean ± SEM of three independent experiments. Data were analyzed by the Student t-test. n.s., no significant difference; *, P < 0.05; **, P < 0.01; ***, P < 0.001.
Fig. 6
Fig. 6
Protein expression profiling and PPI analysis and enriched clusters of DEPs from the proteomic analysis. PPI analysis using String networks reveals the tight interactions between the identified proteins. (A) A Heatmap of representative DEPs between OP-9 cells and J22352-treated OP-9 cells was generated using Morpheus networks by hierarchical clustering. The protein abundance is shown with colors from high (red) to low (blue). (B) PPI analysis of down-regulated DEPs and (C) the corresponding enriched clusters. (D) PPI analysis of up-regulated DEPs and (E) the related enriched clusters. PPI, protein–protein interaction; DEPs, differentially expressed proteins.
Fig. 7
Fig. 7
Enriched GO term, KEGG, and Reactome pathways involved with the DEPs. (A) Representative enriched GO terms, including BP, CC, and MF, and the (B) enriched KEGG and Reactome pathways in the down-regulated DEPs. (C) Representative enriched GO terms, including BP, CC, and MF, and the (D) enriched KEGG and Reactome pathways in the up-regulated DEPs. The color bar represents -log (FDR), and the red line and number beside the bars give the protein numbers involved in the certain signal pathway. GO, gene ontology; KEGG, Kyoto encyclopedia of genes and genomes; DEPs, differentially expressed proteins; BP, biological process; CC, cellular component; MF, molecular function; FDR, false detection rate.

References

    1. Wynn, T. A. & Ramalingam, T. R. Mechanisms of fibrosis: therapeutic translation for fibrotic disease. Nat. Med.18, 1028–1040. 10.1038/nm.2807 (2012). - PMC - PubMed
    1. Zahr, A. A. et al. Bone marrow fibrosis in myelofibrosis: Pathogenesis, prognosis and targeted strategies. Haematologica101, 660–671. 10.3324/haematol.2015.141283 (2016). - PMC - PubMed
    1. Kuter, D. J., Bain, B., Mufti, G., Bagg, A. & Hasserjian, R. P. Bone marrow fibrosis: Pathophysiology and clinical significance of increased bone marrow stromal fibres. Br. J. Haematol.139, 351–362. 10.1111/j.1365-2141.2007.06807.x (2007). - PubMed
    1. Agarwal, A. et al. Bone marrow fibrosis in primary myelofibrosis: Pathogenic mechanisms and the role of TGF-β. Stem Cell. Investig.3, 5. 10.3978/j.issn.2306-9759.2016.02.03 (2016). - PMC - PubMed
    1. Schmitt, A. et al. Pathologic interaction between megakaryocytes and polymorphonuclear leukocytes in myelofibrosis. Blood96, 1342–1347 (2000). - PubMed

MeSH terms

LinkOut - more resources