. 2025 Aug 1;16(1):6986.
doi: 10.1038/s41467-025-62187-x.

Aberrant pace of cortical neuron development in brain organoids from patients with 22q11.2 deletion syndrome-associated schizophrenia

Affiliations

Aberrant pace of cortical neuron development in brain organoids from patients with 22q11.2 deletion syndrome-associated schizophrenia

Sneha B Rao et al. Nat Commun. .

Abstract

Children and adults with 22q11.2 deletion syndrome (22q11.2DS) experience cognitive and emotional challenges and face a markedly increased risk for schizophrenia (SCZ), yet how this deletion alters early human brain development remains unclear. Using cerebral cortex organoids derived from individuals with 22q11.2DS and SCZ, we identify cell-type-specific developmental abnormalities. Single-cell RNA sequencing and experimental validation reveal delayed cortical neuron maturation, with increased neural progenitor proliferation and a reduced proportion of more mature neurons. We observe disrupted molecular programs linked to neuronal maturation, sparser neurites, and blunted glutamate-induced Ca²⁺ responses. The aberrant transcriptional profile is enriched for neuropsychiatric risk genes. MicroRNA profiling suggests that DGCR8 haploinsufficiency contributes to these effects via dysregulation of genes that control the pace of maturation. Protein-protein interaction network analysis highlights complementary roles for additional deleted genes. Our study reveals consistent developmental and molecular defects caused by 22q11.2 deletions, offering insights into disease mechanisms and therapeutic strategies.


Conflict of interest statement

Competing interests: The authors declare no competing interests.

Figures

Fig. 1
Fig. 1. Organoid growth and neuronal activity analysis.
a Box plots depicting increase in organoid surface area in patient and control organoids at different time points (n for patient = 4–8, n for control = 4–8) normalized to week 1 (Two-sided t-test, P < 0.05). ns, not significant. b Box plots depicting increase in organoid perimeter in patient and control organoids at different time points (n for both patient and control = 6–8) normalized to week 1 (Two-sided t-test, P < 0.05). c Representative denoised and segmented epifluorescence microscope images (4x) of Ca2+ unit signals detected in organoids in situ. Each experiment was repeated independently twice with similar results. Scale bar, 50 µm. d Average peak-aligned traces (Df/F vs time, zero corresponding to peak time) of Ca2+ transients detected in different units (cells) in patient (red) and control (black) organoids. Three patient and three control organoids were analyzed at this timepoint (average number of cells per organoid: n for patient = 89, n for control = 124). Left: Patient/Control pair 1, Middle: Patient/Control pair 2, Right: Patient/Control pair 3. e Quantification of Ca2+ peak amplitude in patient (red) and control (black) organoids. Patient organoids show significantly lower peak amplitude. Left: Patient/Control pair 1 (two-sample KS test, P = 5.78 × 10−12), middle: Patient/Control pair 2 (two-sample KS test, P = 3.90 × 10−3), right: Patient/Control pair 3 two-sample KS test, P = 3.77 × 10−10). The experiment was repeated 2 times independently with similar results. In (a, b, e), in the boxes, the horizontal line represents the median value, the lower and upper quartiles represent the 25th and 75th percentile, and the whiskers show the maximum and minimum values. Source data are provided in Source Data.xlsx.
Fig. 2
Fig. 2. Cell type composition and proliferation analysis of organoids.
a Annotation of cell types according to a reference of human fetal brain. b UMAP shows distribution of annotated cell types at DIV70 (blue) and DIV150 (orange). c Density maps depicting the differential abundance (log fold changes) in all cell types between patient and control organoids at DIV70. d Volcano plot illustrating differentially abundant neighborhoods between patient and control groups using Milo. The y-axis represents –log₁₀(spatial FDR) of hypothesis testing using Milo, and the x-axis shows the log₂ fold change (patient/control). The horizontal blue dotted line indicates the FDR = 0.05 threshold. e Beeswarm plot visualizing the distribution of log fold changes across neighborhood annotations for each cell type in DIV70 organoids with the dashed line indicating no change. f Representative confocal microscope images (40x) of control (top) and patient (bottom) organoid stained for Ki67 (white), SOX2 (red) and DAPI (blue). Scale bar = 20 µm. g Quantification (number of organoids for patient = 17, n for control = 19, from 3 independent batches). Upper left: % SOX2+ NPCs among DAPI+ cells shows no difference between patients and controls; Upper right: % Ki67+ cycling NPCs (SOX2 + ) shows significant increase in patients (P = 0.04); Lower left: individual paired comparisons indicate no difference in % SOX2+ among DAPI+ cells. Lower right: individual paired comparisons indicate significant increase in patients (Ppair1 = 0.05, Ppair2 = 0.01, Ppair3 = 5.78×10⁻⁵). h Representative images of PIP-FUCCI-labeled NPCs reveals a significant accumulation of G1 NPCs (two-sided t-test P = 0.045, fold change = 1.37) and fewer S phase cells in patients (two-sided t-test P = 0.035, fold change = 0.58). Scale bar = 25 µm. i. Quantification indicates Fewer CTIP2+ neurons (% CTIP2/DAPI+ cells) are found in patients (two-sided student t-test P = 0.01) for both overall and in paired comparison. Q2, Q5, QR19, and QR20 are controls; Q1, Q6, QR23, and QR27 are patients. In (gi), box plots show median (line), 25th–75th percentiles (box), and min–max (whiskers). Source data are provided in Source Data.xlsx.
Fig. 3
Fig. 3. Pseudotime analyses of the pace of neuronal development.
a Pseudotime trajectory of the EN lineage at DIV70 colored by pseudotime. b Ridge plot depicting distribution of cells in the patient and control EN lineage at DIV70. Patient cell distribution is shifted towards early points of the trajectory represented by progenitors while control cell distribution is more dispersed. There is a significant difference between the two distributions (two-sample KS test, P = 1.33 × 10−11). c RNA velocity embedding stream at DIV70 depicting the EN lineage trajectory in control (left) and patient (right) organoids. d UMAP plots colored by differentiation potential in control (left) and patient (right) DIV70 EN lineage. Progenitors in control organoids show high differentiation potential while progenitors in patient organoids show low differentiation potential. e Pseudotime trajectory at DIV150 colored by pseudotime. f Ridge plot showing distribution of cells in patient and control DIV150 EN lineage. Patient cell distribution is largely shifted to early points of the trajectory represented by more immature stages of the lineage while control cell distribution is shifted towards later points along the pseudotime. There is a significant difference between the two distribution (two-sample KS test, P = 2.13 × 10−4). g Pseudotime trajectory of cells in patient and control IN lineage colored by pseudotime. h Ridge plot depicting distribution of cells in patient and control IN lineage along pseudotime. Patient cell distribution is shifted towards early points along pseudotime while control cell distribution is more dispersed. There is a significant difference between the two distributions (two-sample KS test, P = 1.33 × 10−2). i Pseudotime trajectory of progenitor populations generated with Monocle3. Trajectory starts at RG-div and cyc-IPC and progresses to RG-early. Later pseudotimes are represented by RG-late and IN progenitors such as MGE-RG, MGE-IPC and MGE-RG-IPC-DIV. j Ridge plot depicting distribution of progenitors in patient and control lineage Patient cell distribution is shifted largely to early points of the trajectory represented by earlier progenitors while control cell distribution is shifted more towards later time points. There is a significant difference between the two distribution (two-sample KS test, P = 4.53 × 10−6), indicating a developmental delay at the level of the progenitors.
Fig. 4
Fig. 4. Morphological and transcriptional signatures of impaired EN maturation.
a Representative 3D traces of neurons generated from confocal images of DIV70 cultures of control (left) and patient (right) organoids. b Quantification of combined patient and control number of primary neurites per cell (two-sided student t-test, p = 0.013, n = 500 for control, n = 536 for patient, upper left), total neurite length (two-sided student t-test, p = 0.0209, n = 458 for control, n = 488 for patient, upper middle) and number of branchpoints per cell (two-sided student t-test, p = 0.0038, n = 458 for control, n = 488 for patient, upper right) across multiple experiments. 8–11 organoids were analyzed per line over 3–4 batches for a total of 66–166 cells for each line. Data are presented as mean ± SD, each point represents averaged data from a unique line and batch. Quantification of number of primary neurites per cell (bottom left), total neurite length (bottom middle) and number of branchpoints per cell (bottom right) for different patient and control paired organoids. Data are presented as mean ± SD. Across all pairs, patient neurons have a significantly simpler neurite architecture (two-sided Mann Whitney Test, P < 0.05). Neurons analyzed with immunostaining were positive for MAP2 and immature neuron marker DCX (see also Fig. S1b, bottom). c Volcano plot showing differentially expressed genes using DEseq2 (FDR-adjusted Padj < 0.05) in sorted neurons from DIV70 patient organoids compared to control. d, e GO term enrichment analysis of top downregulated (d) and upregulated (e) DEGs in patient neurons (FDR B&H < 0.05). f SynGO gene enrichment analysis of genes downregulated (left) and upregulated (right) in patient neurons. There is a significant enrichment of synaptic genes among the downregulated genes (P = 0.00005), with a particular enrichment for transcripts with presynaptic/synaptic vesicle functions (GO:0045202/GO:0098793, P = 0.0331), but no significant enrichment among upregulated genes. Source data are provided in Source Data.xlsx.
Fig. 5
Fig. 5. Gene modules and functions dysregulated in the EN lineage of patient organoids.
a A volcano plot displaying DEGs (hurdle test using MAST, Bonferroni corrected P < 0.05) identified in patient-derived RG-div compared to control is shown, with the x-axis representing the log odds of expression between genotypes (Coeff). Dotted lines indicate the thresholds for Coeff > 0.02 or < −0.02. The gene symbols for the top 15 DEGs are labeled. b GO term enrichment analysis of DEGs in patient RG-div. Cell cycle and proliferation genes are upregulated while neurogenic genes are downregulated (FDR B&H < 0.05). c A volcano plot displaying DEGs (hurdle test using MAST, Bonferroni corrected P < 0.05) identified in patient-derived ENs compared to control is shown, with the x-axis representing the log odds of expression between genotypes (Coefficient, Coeff). Dotted lines indicate the thresholds for Coeff > 0.02 or < −0.02. The gene symbols for the top 15 DEGs are labeled. d GO term enrichment analysis of DEGs in patient ENs. Genes related to negative regulation of neurogenesis are upregulated while genes related to promotion of neurogenesis are downregulated (FDR B&H < 0.05). e UMAP of cell clusters in EN lineage cells in control organoids. f Identification of clusters of co-expressed genes using scWGCNA in control EN lineage cells. From left to right: Modules 2 and 9 are expressed in cycling progenitors and progenitor cells respectively and modules 3 and 4 are expressed in EN clusters. g Scanpy scoring of module genes identified in (e) and (f) in control and patient EN lineage cells. Expression of modules 2 and 9 are significantly lower (module 2, P = 0.002591; module 9, P = 0.03008) in control compared to patient cells. *p < 0.05, **p < 0.01, ***p < 0.001, wilcox test.
Fig. 6
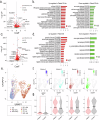
Fig. 6. 22q11.2-associated genes and genetic pathways underlying altered developmental pace.
a Volcano plot depicting differentially expressed miRNAs in whole patient organoids at DIV70 using DEseq2 (FDR-adjusted Padj < 0.05). b mirNet analysis of the network of downregulated miRNAs in patient organoids (c) GO term enrichment of mirNet-T computed targets of downregulated miRNAs. Targets are enriched for nuclear genes associated with cell cycle and cell division. d Latent time analysis of a subset of putative target genes of downregulated miRNAs using scVelo and CellRank; y axis denotes expression level; x axis denotes latent time. 95% Confidence Intervals (shading). e PPI network analysis of dysregulated genes in patient RG-div (left) and ENs (right) with scoring of the contributions of the 22q11.2 locus genes to the network.
Fig. 7
Fig. 7. Overlap between genes harboring rare LoF risk variants and EN lineage cell types.
Results from permutation-based analysis of overlap between EN lineage cell types and DEGs harboring rare coding damaging variants at DIV70 (top) and DIV150 (bottom) using the DNENRICH pipeline and curated reference datasets. Overlap between cell types in the EN lineage and dysregulated genes harboring LoF risk variants (a), highly intolerant LoF variants (pLI ≥ 0.9) (b), or synonymous variants (c). Permutation P values were calculated by simulating the occurrence of genes in human and comparing the observed occurrence.

Update of

References

    1. Shprintzen, R. J. et al. Velo-cardio-facial syndrome. Curr. Opin. Pediatr.17, 725–730 (2005). - PubMed
    1. Robin, N. H. & Shprintzen, R. J. Defining the clinical spectrum of deletion 22q11.2. J. Pediatr.147, 90–96 (2005). - PubMed
    1. Kobrynski, L. J. & Sullivan, K. E. Velocardiofacial syndrome, DiGeorge syndrome: the chromosome 22q11.2 deletion syndromes. Lancet370, 1443–1452 (2007). - PubMed
    1. Botto, L. D. et al. A population-based study of the 22q11.2 deletion: phenotype, incidence, and contribution to major birth defects in the population. Pediatrics112, 101–107 (2003). - PubMed
    1. Morrison, S. et al. Cognitive deficits in childhood, adolescence and adulthood in 22q11.2 deletion syndrome and association with psychopathology. Transl. Psychiatry10, 53 (2020). - PMC - PubMed

MeSH terms