. 2025 Oct;32(10):1999-2011.
doi: 10.1038/s41594-025-01622-5. Epub 2025 Aug 1.

The molecular basis of lamin-specific chromatin interactions

Affiliations

The molecular basis of lamin-specific chromatin interactions

Baihui Wang et al. Nat Struct Mol Biol. 2025 Oct.

Abstract

In the cell nucleus, chromatin is anchored to the nuclear lamina, a network of lamin filaments and binding proteins that underly the inner nuclear membrane. The nuclear lamina is involved in chromatin organization through the interaction of lamina-associated domains within the densely packed heterochromatin regions. Using cryo-focused ion beam milling in conjunction with cryo-electron tomography, we analyzed the distribution of nucleosomes at the lamin-chromatin interface at the nanometer scale. Depletion of lamins A and C reduced nucleosome concentration at the nuclear periphery, while B-type lamin depletion contributed to nucleosome density in proximity to the lamina but not further away. We then investigated whether specific lamins can mediate direct interactions with chromatin. Using cryo-electron microscopy, we identified a specific binding motif of the lamin A tail domain that interacts with nucleosomes, distinguishing it from the other lamin isoforms. Furthermore, we examined chromatin structure dynamics using a genome-wide analysis that revealed lamin-dependent macroscopic-scale alterations in gene expression and chromatin remodeling. Our findings provide detailed insights into the dynamic and structural interplay between lamin isoforms and chromatin, molecular interactions that shape chromatin architecture and epigenetic regulation.


Conflict of interest statement

Competing interests: The authors declare no competing interests.

Figures

Fig. 1
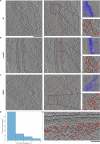
Fig. 1. The local concentration and distribution of nucleosomes at the NE.
a, An xy tomographic slice, 8.8 Å in thickness, of an MEF cell thinned by cryo-FIB. The nucleoplasm (Nuc), NL, NE and cytoplasm (Cyt) are indicated. b, Segmented view of a tomogram depicting the NE of a cell. Nucleosomes and lamins are colored on the basis of their local concentration, from purple to green and yellow to red. The NPC was manually placed (gray, EMD-12814). c, The local concentration of nucleosomes was defined as the number of neighboring nucleosomes within a 24-nm radius, plotted as a function of their distance from the NL. The concentration plateaued at an average of seven neighbouring nucleosomes (~1.4 × 10⁵ nucleosomes per μm³) beyond 60 nm from the NL. d, The relationship between nucleosome concentration and lamin concentration is shown. For each lamin segment, the number of neighboring lamin filaments was determined and plotted against the local nucleosome concentration of its nearest nucleosome. e, The nucleosome concentration probability was plotted as a function of the distance to the closest lamin filament in each tomogram (Extended Data Fig. 4g). Their associated distance of peaks is plotted in e, showing a median value of 47 nm. f, The nucleosome probability density as a function of the distance between nucleosomes and lamins is plotted for each tomogram (Extended Data Fig. 4i). The peaks are plotted against associated distance values in f. The median distance was 22 ± 5 nm. g, Images highlighting examples of direct lamin–nucleosome interactions. h, The nucleosome concentration is plotted against the distance to the center of the closest NPC. i, Segmented view of a measurement in h. The nucleosomes are colored on the basis of their concentration. j, The concentration of lamin filaments is plotted against their distance to the closest NPC. All box plots show a box between the 25th and 75th percentiles, the median as a horizontal line, the mean as a black square and 1.5 s.d. as whiskers. Significance was calculated using a one-way ANOVA. ****P < 0.0001, ***P < 0.001, **P < 0.01 and *P < 0.05; not significant (NS), P > 0.05. A total of 15 tomograms were used for the analysis shown in c–f, h and j. Gray dashed lines in c, h and j connect the mean values of each column. Each colored triangle in e and f represents the most frequent minimal distance between nucleosomes and lamin filaments, in each tomogram.
Fig. 2
Fig. 2. Alterations of nuclei, filaments and nucleosome distribution in lamin-KO cells.
a, The chromatin in WT, LmnaKO and LBDKO MEF cells was stained by DAPI and imaged by 3D-SIM. b, Left: quantification of high-density fluorescent chromatin foci exhibited significantly lower overall fluorescence intensity in LmnaKO nuclei compared to LBDKO and WT nuclei. Right: quantification of DAPI signal revealed a reduction in peripheral chromatin in both lamin-KO cells compared to WT cells. The signal was quantified within the 40% distal area of nuclei. The numbers of nuclei assessed for volume calculation were 48 and 35 for LmnaKO, 89 and 47 for LBDKO and 47 and 36 for WT cells. c, The meshwork density of lamin filaments is shown. The number of neighboring filaments detected at <24 nm around each lamin segment is plotted. The fraction of lamins without neighboring filament was significantly increased from 16% in the WT to 28% in LmnaKO cells and 19% in LBDKO cells, with a drop in the mean neighbour count of 2.1, 1.6 and 1.9 in each cell line, respectively (Extended Data Fig. 4j). d, The overall minimal lamin-to-nucleosome distances are plotted for each cell line (as in Fig. 1f). Each data point represents the highest nucleosome density distance per tomogram. The medians of the minimal lamin-to-nucleosome distances were 18.4 ± 4.1 nm for LmnaKO cells and 18.7 ± 3.8 nm for LBDKO cells, corresponding to ~82% of the WT’s mean. Each colored diamond indicates the average minimal lamin–nucleosome distance in a single tomogram. e, The concentration of nucleosomes as a function of their distance from the NL (as in Fig. 1c). The lamin-independent average nucleosome concentration is presented in Extended Data Fig. 4k. Gray lines connect the median values of each column. f, For each cell line, nucleosomes are grouped into two by a distance to the center of the closest NPC of ≤160 nm or >160 nm. All box plots show a box between the 25th and 75th percentiles, the median as a horizontal line, the mean as a black square and 1.5 s.d. as whiskers. Significance was calculated using a one-way ANOVA. ****P < 0.0001, ***P < 0.001, **P < 0.01 and *P < 0.05; NS, P > 0.05. For the analysis shown in cf, 15 WT, 13 LmnaKO and 15 LBDKO tomograms were used.
Fig. 3
Fig. 3. The tail domain of lamin A interacts with H2A–H2B heterodimers and nucleosomes.
a, A schematic view of the lamin A protein shows the various protein domains and the position of the NLS. The sequence of the lamin A tail domain, amino acids 548–585, is aligned to the other main lamin isoforms: lamin C, lamin B1 and lamin B2. The relatively conserved amino acids are colored. b, The affinity of LA 430–585 toward the H2A–H2B heterodimer was determined by FCS (Methods and Extended Data Fig. 6c). c, The affinity between LA 430–585 and nucleosomes was quantified by an EMSA (Extended Data Fig. 7b). Data are presented as the mean values ± s.d. d, The structure of the LA 430–585 (cyan)–nucleosome (gray) complex was determined by cryo-EM. The densities corresponding to the Ig-like domain (arrowhead) and additional lamin A tail (red dotted oval) were identified. The Ig-like domain was filtered to 6.8 Å. e, Variability in the position of the Ig-like domain, filtered to 6.8 Å, was detected across different structural classes (pinkish, yellow and cyan), indicating that the Ig-like domain exhibits greater flexibility compared to the stationary binding site (red dotted oval in d). f, The nucleosome structure (PDB 6ZHX) fitted into the EM density indicated that LA 430–585 interacts with the H2A–H2B heterodimer. Three independent biological replicates were applied to analyze b and c. Source data
Fig. 4
Fig. 4. Amino acids 579–583 of lamin A mediate interaction with the nucleosome.
a, Cryo-EM structural analysis of the peptide LA 572–588 (cyan) interacting with the nucleosome (gray) through the H2A–H2B heterodimer (yellow and pinkish, respectively). b, Eight amino acids (AEYNLRSR) of the peptide LA 572–588 were identified in the negatively charged acidic patch of the nucleosome. c, Five amino acids (YNLRS) specifically interact with H2A–H2B within nucleosome. This interaction is stabilized by H-bonds, hydrophobic interactions and salt bridges. d, A schematic view of the experimental design used for studying lamin A–nucleosome interactions by TIRF microscopy. A passivated glass coverslip was patterned using deep-ultraviolet illumination (1); then, the patterned surface was coated with fluorescently labeled nucleosomes (2). The functionalized coverslip was mounted onto a PEGylated glass slide to fabricate a chamber, where fluorescently labeled LA 430–585 polypeptide was injected at the onset of the binding reaction (3). e, The fluorescence intensity of the labeled LA 430–585 polypeptide (top) associated with patterned fluorescently labeled nucleosomes (bottom) for representative single images, averaged images of 14 frames containing a total of 126 patterned spots and related s.d. images. f, The LA 572–588 peptide competes with the LA 430–585 polypeptide for nucleosome binding. The unlabeled peptide was added to the reaction mixture described in d. The fluorescence intensity of the LA 430–585 polypeptide (top) associated with the patterned fluorescently labeled nucleosomes (bottom) is shown for average images of at least 24 frames. g, The fluorescence ratio of nucleosome-associated LA 430–585 against spotted nucleosomes was calculated (Methods), and a curve was fitted with a four-parameter dose–response Hill–Langmuir equation (Methods). The best fit of the overall dataset was obtained for a maximal ratio fixed to less than 1 and showed an EC50 of 5 µM. R2 was 0.78 for the overall dataset. In e and f, fluorescence calibration bars are provided. All spots are 3 μm in diameter.
Fig. 5
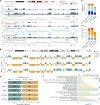
Fig. 5. Lamins and C-tail-deficient lamin A induce heterochromatin remodeling.
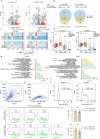
a, A representative genomic region of chromosome 18 (40 Mb on chr18: 35,000,000–75,000,000) showing tracks for lamin A/C ChIP-seq, H3K9me3 ChIP-seq and 4f-SAMMY-seq in the WT, LmnaKO and LBDKO cells. 4f-SAMMY-seq solubility profiles comparing the different cell lines are represented as the log of sequencing reads of the more soluble S2S over those of the less soluble S3. The line represents the mean of triplicates and the s.d. is shown as a shadow. Below each track pair, the respective significantly differentially soluble regions are indicated as follows: S2S up, red; S2S down, orange; S3 down, dark blue; S3 up, light blue. b, The percentages of the genome affected by the removal of lamin genes are shown as a stacked bar plot, following the color code described in a. c, Stacked bar plot showing the number of protein-coding genes with altered solubility (Methods). d, Chromatin compartment analysis using 4f-SAMMY-seq (Methods). The representative first eigenvector on chromosome 8 (32,000,000–95,000,000) at 50-kb resolution is reported for WT, LmnaKO and LBDKO cells. Regions with concordant (A–A and B–B) or discordant compartment (B–A and A–B) classification in LmnaKO and LBDKO compared to WT are marked. e, A stacked bar plot showing average percentages of A and B chromatin compartments in WT. Top, chromatin compartment shifts were detected in LmnaKO and LBDKO cells when compared to WT cells. Bottom, expression of full-length lamin A (WT + LA 1–646) or C-tail-deficient lamin A (WT + LA 1–429) in WT cells, indicating that lamin A tail domain supports B compartment (WT + LA 1–429 compared to WT + LA 1-646 cells). f, GO enrichment analysis of genes undergoing compartment changes comparing WT + LA 1–646 to WT + LA 1–429. Bar plots represent significantly enriched Reactome (REACT), biological process (BP), cellular component (CC) and molecular function (MF). HATs, histone acetyltransferases; CENPA, centromere protein A.
Fig. 6
Fig. 6. Schematic model of the NE in WT and LmnaKO MEFs.
The model shows lamins and chromatin organization underneath the NE in WT and LmnaKO MEF cells. The chromatin (nucleosomes in green) forms a dense structure at the NE by association with the NL, consisting of lamins A/C (red) and lamins B1/B2 (yellow) in WT cells. Top left, lamin A can interact with the nucleosomes through its tail domain. In the absence of A-type lamins (LmnaKO), chromatin remodeling affected the concentration of nucleosomes at the NE, which are less densely packed and shifted closer to the more dispersed NL. These structural effects lead to major nuclear reorganization, including a large number of genes moving from transcriptionally active compartment A to inactive compartment B and vice versa.
Extended Data Fig. 1
Extended Data Fig. 1. Detection of nucleosomes in tomograms of cryo-FIB milled lamellae of MEFs.
a. Nucleosome picking is shown for one of the WT tomograms. The image on the left shows a xy slice with 8.8 Å thickness through the tomogram. The nuclear envelope was imaged in a side view orientation. Scale bar is 200 nm. The image in the middle shows the same xy-slice as on the left, together with the coordinates of the nucleosomes (red dots), which were detected in that slice. The apparent low density of picked nucleosomes in this visualization is due to the fact that only nucleosomes with their z coordinate falling exactly within this xy-slice are displayed. The top image on the right side shows this xy-slice, overlaid with all the nucleosome coordinates (blue dots), which were picked in this tomogram. This context was used to annotate cytoplasmic false-positive nucleosome detections (blue dots encircled with a yellow dashed line). In this tomogram, 10 cytoplasmic false-positive particles were detected. A total of 2673 subtomograms were extracted from this tomogram. Therefore, the individual cytoplasmic (false-positive) picking ratio (CPR) of this tomogram is 0.4%. The bottom image on the right side shows a zoomed view on the picked nucleosomes (red circles). Scale bar is 100 nm. b. Nucleosome picking is shown for one of the LmnaKO tomograms. In this tomogram zero cytoplasmic false-positive particles were detected, therefore the CPR is 0%. c. Nucleosome picking is shown for one of the LBDKO tomograms. Here, the nuclear envelope was imaged in a top view orientation. Cytoplasmic false-positive particles are shown per xy-slice in the middle image (red dots encircled with a yellow dashed line) and all cytoplasmic false-positive particles identified in this tomogram are shown in the top image on the right (blue dots encircled with a yellow dashed line). In this tomogram, 156 cytoplasmic false-positive particles were detected. A total of 1842 subtomograms were extracted from this tomogram and therefore its CPR is 8.5%. d. Histogram of all CPR values per tomogram of the complete dataset (43 tomograms). Most of the tomograms (30 tomograms) exhibit CPR values between 0 to 3%. e. Zoomed view on individual nucleosome detections. The nucleosome coordinates, which were picked in the shown xy-slice, are depicted as red circles. Scale bar is 100 nm.
Extended Data Fig. 2
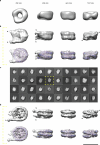
Extended Data Fig. 2. Sub-tomogram averaging of in-situ nucleosomes.
a. The initial reference for 3D refinement and 3D classification is shown in 4 different views, namely disk view, side view, gyre view, and front view. The reference was obtained by low-pass filtering the nucleosome structure EMD 33132 to 40 Å resolution. At this resolution the histones in the core of the nucleosome disappear and the DNA resembles a torus. b. In the top row the in-situ nucleosome consensus average is displayed. Compared to the initial reference, the density of the histone core is restored and linker DNA densities appear (black arrowheads). In the bottom row the docking of the nucleosome model PDB-7XD1 in the consensus nucleosome average is shown. c. The subtomograms, which were averaged to form the consensus average (103173 particles), were classified with 3D classification into 40 classes. The image shows the central xy-slices (thickness 4.4 Å) of the resulting class averages in disk view orientation. All class averages resemble nucleosome features at varying resolutions. The class average, which attracted the most particles (13255 particles), is framed by a yellow dashed line. d. Subsequently, these particles were averaged with 3D refinement. In the top row the resulting average is displayed. It shows clear features of a canonical nucleosome structure, with extended linker DNA (black arrowheads), a well-defined histone core, and the DNA wrapped around the histone core in a left-handed manner. In the bottom row the docking of the nucleosome model PDB-7XD1 in the canonical nucleosome average is shown. Scale bar is 10 nm.
Extended Data Fig. 3
Extended Data Fig. 3. Gallery of tomograms used for the analysis of WT (a), LmnaKO (b), and LBDKO (c) MEFs.
Each tomogram is depicted by the xy-coordinates of the three analysed structures: lamin coordinates are shown in red, nucleosome coordinates are coloured by increasing concentration, as indicated by the calibration bar, and NPC coordinates are shown in grey.
Extended Data Fig. 4
Extended Data Fig. 4. Local distribution and concentration of nucleosomes and lamins in WT, LmnaKO, LBDKO MEF cells.
a. A schematic illustration indicating how we quantified local nucleosome concentration as a function of distance from a lamin filament. The number of nucleosomes located within a 24 nm radius of a nucleosome positioned 20 nm from a lamin filament. b. Bar plot showed nucleosome concentration in each tomogram from WT MEFs. c-d. Regions with high local nucleosome concentration, with ≥4 neighbouring nucleosomes (c) or nucleosomes with ≤3 or fewer neighbours in grey (d). e. A Schematic illustration exemplifying the approach used to measure the relationship between local nucleosome concentration and lamin concentration. For each lamin segment, the number of neighbouring lamin segments within a 24 nm radius was quantified. The coordinates of the nearest nucleosome to each lamin segment were then identified, and the number of neighbouring nucleosomes within a 24 nm radius of that nucleosome was calculated. These values were plotted as a function of the corresponding local lamin density. f. A schematic diagram illustrating how the distance from each nucleosome to its nearest lamin filament was measured. These distances were plotted in (g) for each tomogram, using a line fit for an average of ~2400 particles per tomogram. High-density peaks are indicated by triangles. h. A schematic diagram illustrating how the distance from each lamin filament to its nearest nucleosome was determined. These distances were plotted in (i) for each tomogram. The peaks are indicated by triangles. The shadowed region in (i) highlighted that 1.6% of nucleosomes are located within 10 nm of lamin filaments. In these instances, direct lamin-nucleosome interactions can be detected. j. For each lamin segment, the number of neighbouring filaments was plotted for each cell line. The mean neighbouring filaments count was 2.1, 1.6 and 1.9 for WT, LmnaKO and LBDKO cells, respectively. k. The number of neighbouring nucleosomes for each nucleosome was plotted, resulting in mean values of 6.0, 4.8 and 6.3 neighbouring nucleosomes for WT, LmnaKO and LBDKO cells, respectively. All boxplots show a box between 25th and 75th percentile, median as a horizontal line, mean as a black square, whiskers represent 1.5 standard deviations. Significance calculated using a one-way ANOVA. p-value < 0.0001 (****).
Extended Data Fig. 5
Extended Data Fig. 5. Changes in chromatin architecture in lamin knockout MEF cells.
a. Super resolution structured illumination microscopy, 3D-SIM, images of WT, LmnaKO, LBDKO MEF cells. Chromatin was stained with DAPI. b. Quantification of nuclear volumes indicated increase in both lamin knockout cells (left). Quantification of nuclear area (using projection images) showed a slight increase in the lamin knockout cell lines, compared to the WT (right). c. The number of high-density fluorescence chromatin foci, exhibited a significant increase in both LmnaKO and LBDKO compared to WT nuclei (left), while the total area of foci normalized to the nucleus area remained similar across all cell lines (right). The number of nuclei assessed were 35 for LmnaKO, 47 for LBDKO, and 36 for WT cells. Data were from two distinct experiments. All boxplots show a box between the 25th and 75th percentiles, the median as a horizontal line, the mean as a black square, and whiskers represent 1.5 standard deviations. Significance was calculated using a one-way ANOVA. p-value < 0.0001(****), p-value < 0.001(***), p-value < 0.05 (*), and n.s. p-value > 0.05.
Extended Data Fig. 6
Extended Data Fig. 6. The lamin A tail domain and its interactions with H2A-H2B.
a. Five truncations of lamin A tail domain were used during in vitro biochemical and structural analyses. b. Pull-down assay for identifying the region within lamin A responsible for H2A-H2B binding. 100 ug of each candidate truncation, LA 394-646, LA 394-548, LA 430-585, LA 430-579, LA 430-560 and His-GST as a negative control were immobilized on the 200 µl Ni-NTA resin. 5 µl of each sample was analysed by SDS-PAGE (lane 1-6). Purified H2A-H2B heterodimer was shown in lane 7. 100 µg H2A-H2B was applied to each sample and after several rounds of washing and migrated on the SDS-PAGE (Lane 8-13). c. Binding isotherms based on the translational diffusion times observed in FCS measurements as a function of lamin concentration yielded a binding affinity between LA 430-585 and H2A-H2B heterodimer of 12 ± 1 µM, confirmed by three biological replicates. d. Sequence alignment of lamin A from amino acid 548 to 585 in 5 different species, HslaminA (homosapiens lamin A), MslaminA (musmusculus lamin A), RnlaminA (Rattusnorvegicus lamin A), DrlaminA (Daniorerio lamin A), XtlaminA (Xenopustropicalis lamin A). It shows that the tail domain of lamin A is highly conserved, especially in the region of 578-585 (underlined in blue). e. A schematic illustration shows that the C-terminal laminA domain can be extended to a distance of up to ~51 nm away from the lamin filament. The nucleosome-binding site within the C-terminal laminA domain is located at a distance of ≤30 nm away from the lamin rod domain. Three independent replicates were done for b and c. Source data
Extended Data Fig. 7
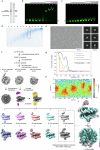
Extended Data Fig. 7. Biochemical and structural analysis of LA 430-585 and nucleosome.
a. In vitro assembled nucleosome was analysed using a 6% native PAGE. b. EMSA of LA 430-585 binding to fluorescently labelled nucleosomes. The nucleosome position was marked by black arrowhead. Data was collected from three biological replicates. This experiment was used to quantify the affinity of interactions in Fig. 3c. c. EMSA of LB1 432-569 binding to fluorescently labelled nucleosomes. There is no shifted band, implying no direct interaction between lamin B1 tail domain and nucleosomes. d. LA 430-585 and nucleosome complex after Grafix was analysed by SDS-PAGE. Fraction 18 was collected for cryo-EM sample preparation. e. Representative micrograph of the dataset used to determine the structure of LA 430-585 and nucleosome complex. (left) 2D class averages generated from the dataset. (right) f. Flow chart for image processing by cryoSPARC. g. Gold standard Fourier shell correlation (FSC) curves of final 3D reconstitution (3.6 Å). h. Angular distribution of particles. i. Final reconstruction of the LA 430-585-nucleosome complex coloured by local resolution. Calibration bars are provided. Three independent replicates were done for b. Source data
Extended Data Fig. 8
Extended Data Fig. 8. High resolution structural analysis and biochemical binding of peptide (LA 572-588) and nucleosome.
a. Representative micrograph of the peptide-nucleosome dataset was used to determine the complex structure. Typical 2D class averages of the peptide-nucleosome structure. b. Flow chart shows the image processing strategy and final 3D map (2.3 Å) coloured by local resolution. c. Gyre and disc views of the peptide-nucleosome structure shows that peptides are localized on the both sides of H2A-H2B positioned in nucleosome. d. FSC curve of final 3D map. e. Angular distribution of particles. b. e. Calibration bars are provided. f. LB1 432-569 does not bind to nucleosomes. Surfaces functionalized with Alexa fluor 488 labelled nucleosomes were incubated with 1 µM of soluble, CF660R fluorescently labelled LB1 432-569 and imaged after 1 hour. The panels show lamin B1 fluorescence intensity (upper row) associated with the spotted fluorescently labelled nucleosomes (bottom row) for a representative single image, for an average image of 18 frames and a total of 162 spots, and its related significantly low standard deviation image. Fluorescence calibration bars are provided. All spots are 3 μm in diameter. The graph on the right shows that nucleosome-associated lamin fluorescence indicated that lamin B1 (Bound LB1 432-569) fluorescence detected on patterned is negligeable compared to that of lamin A (Bound LA 430-585), even for 4 times more immobilised nucleosomes. For lamin A, 399 fluorescence values ranged between 361 and 2446 a.u., and for lamin B1, 370 fluorescence values ranged between 0 and 142 a.u.
Extended Data Fig. 9
Extended Data Fig. 9. Euchromatin and heterochromatin distribution captured by 4 f -SAMMY-seq.
a. Distribution along a representative region of chromosome 4 (chr4: 20,000,000-END) of 4f-SAMMY-seq consensus track of WT MEF (S2S vs S3). The continuous line represents the mean across the WT replicates and the lighter colour shadows represents the standard deviation. Positive signal enrichments, defined as the ratio of S2S over S3, are enriched in the most accessible S2S fraction and coincide with euchromatin, while its negative values, enriched in the insoluble S3 fraction, match lamina-associated heterochromatic regions, LADs. The ChIP-seq tracks for histone mark associated to active chromatin (H3K27ac – purple, H3K4me3 - red), constitutive heterochromatin (H3K9me3 –blue) and laminA/C are also shown. For ChIP-seq data, the y axis range is set to zero as minimum value. b. Genome-wide Spearman correlation for 4f-SAMMY-seq (S2S vs S3 enrichment) between three WT replicates (WT1, WT2, WT3), histone modifications ChIP-seq (H3K27ac, H3K4me3), laminA/C ChIP-seq with H3K9me3. c. Meta-profiles of H3K9me3 enrichment signal over S3 UP and S3 DOWN genomic regions in LmnaKO (top) and LBDKO (bottom). Lines represent two replicates of the H3K9me3 experiment, WT (green), LmnaKO (yellow), and LBDKO (light blue). The x-axis shows the relative position with respect to the start (domain start, DS) and end (domain end, DE) of S3 UP and S3 DOWN genomic regions, along with 1 Mb flanking regions. d. Metaprofile of H3K9me3 enrichment within 2 Mb of H3K9me3 domains in WT (green), LmnaKO (yellow), and LBDKO (light blue) MEF cells. The A-B circles illustrate the method used to calculate the relative differences in H3K9me3 ChIP over input enrichment at two points in the H3K9me3 domain: the Domain Start (DS) (point A) and the center of the peak (point B). The box-plot distribution on the right shows the A-B ChIP-seq enrichment for MEF WT (green), LmnaKO (yellow), and LBDKO (light blue) cells. The lower and upper edges of each box correspond to the first and third quartiles, respectively, with the horizontal bar representing the median. Whiskers extend up to 1.5 times the interquartile range (IQR) from the edges. Data points outside this range are outliers and are represented by dots. Statistical analysis was performed using a two-sided Wilcoxon test. WT vs LBDKO p = 0.0062 (**); WT vs LmnaKO p = 0.3757 (n.s.). Two independently processed ChIP experiments were performed for each condition. e. Proportional Venn diagram showing the common S3 UP and S3 DOWN genomic regions in LmnaKO and LBDKO. f. Distribution of significantly differentially soluble regions across chromosomes in LmnaKO (left) and LBDKO (right) in comparison to WT cells. Colour code: S2S UP (red), S2S DOWN (orange), S3 UP (light blue), S3 DOWN (blue).
Extended Data Fig. 10
Extended Data Fig. 10. Lamin specific genome alterations.
a. Volcano plots showing differentially expressed genes (DEGs) between WT and LmnaKO (left), WT and LBDKO (right). The log2FC value > 3, log2FC value < −3 and p-adj < 0.01 (BH) are the cut-off value for significant upregulated (red), and downregulated (blue) Differentially Expressed Genes (DEGs). b. Proportional Venn diagram of common up-regulated (left) and down-regulated (right) DEGs in LmnaKO and LBDKO. c. Heat maps of solubility profiles of downregulated (above) and upregulated (below) Differentially Expressed Genes (DEGs) aligned to the transcription start and end sites (TSS and TES), shown as triplicates. Red and blue correspond to higher or lower accessibility, respectively. d. Box-plot distribution of log2 of transcripts per million (TPM + 1) in significantly differentially soluble regions in LmnaKO (left) and LBDKO (right). The box lower and upper edges are the first and third quartiles, and the horizontal bar is the median. Whiskers extend up to 1.5 times the interquartile range (IQR) from the edges. Data points outside the range are outliers and are represented by dots. Statistical significance was assessed using two-sided Wilcoxon test and labelled as p-value < 0.0001(****), p-value < 0,001(***), p-value < 0.01(**), p-value < 0.05 (*), and n.s. p-value > 0.05. Three independent replicates were performed for each condition. e. Gene Ontology enrichment analysis of genes that change compartment exclusively in LmnaKO (left) or LBDKO (right); bar plots represent significantly enriched biological processes. f. Exclusion of debris based on FSC-A versus SSC-A. g. Exclusion of doublets using FSC-A versus FSC-H. h. Gating of EGFP-positive cells using a negative non-transfected negative cells to define the gate. This gating strategy was applied to WT MEF transfected with LA 1-646-EGFP or LA 1-429-EGFP, which were used for 4f-SAMMY-seq assay. Corresponding results are shown in Fig. 5e–f. i. Histogram of each replicate of EGFP-transfected cells used for 4f-SAMMY-seq. Bar plots quantifying the percentage of EGFP-positive cells and the mean fluorescence intensity (MFI) in WT cells transfected with LA 1-646-EGFP or LA1-429-EGFP, as measured by flow cytometry. Data are presented as mean with SD. Significance was calculated using a two-tailed unpaired t-test (n.s. p-value > 0.05). Three independent biological replicates were performed for LA 1-646-EGFP and four for LA1-429-EGFP.

References

    1. Wong, X., Melendez-Perez, A. J. & Reddy, K. L. The nuclear lamina. Cold Spring Harb. Perspect. Biol.14, a040113 (2022). - PMC - PubMed
    1. Vahabikashi, A., Adam, S. A., Medalia, O. & Goldman, R. D. Nuclear lamins: structure and function in mechanobiology. APL Bioeng.6, 011503 (2022). - PMC - PubMed
    1. Burke, B. & Stewart, C. L. The nuclear lamins: flexibility in function. Nat. Rev. Mol. Cell Biol.14, 13–24 (2013). - PubMed
    1. Murray-Nerger, L. A. & Cristea, I. M. Lamin post-translational modifications: emerging toggles of nuclear organization and function. Trends Biochem. Sci.46, 832–847 (2021). - PMC - PubMed
    1. Shimi, T. et al. Structural organization of nuclear lamins A, C, B1, and B2 revealed by superresolution microscopy. Mol. Biol. Cell26, 4075–4086 (2015). - PMC - PubMed

LinkOut - more resources