. 2025 Aug;14(15):e71126.
doi: 10.1002/cam4.71126.

CTHRC1 Derived From Cancer-Associated Fibroblasts Promotes Pancreatic Cancer Progression and Metastasis via the LIF-STAT3 Pathway

Affiliations

CTHRC1 Derived From Cancer-Associated Fibroblasts Promotes Pancreatic Cancer Progression and Metastasis via the LIF-STAT3 Pathway

Hang Yin et al. Cancer Med. 2025 Aug.

Abstract

Background: Collagen triple helix repeat containing 1 (CTHRC1) is a secreted protein involved in tissue remodeling and fibrotic processes, which also suggests emerging roles in cancer. Studies have shown that it is mainly expressed in the outer membrane fibroblasts of injured arteries and in the neointimal smooth muscle cells, where it promotes cell migration and tissue damage repair. However, the regulatory role of CTHRC1 as a tumor microenvironment factor in pancreatic cancer is not well understood.

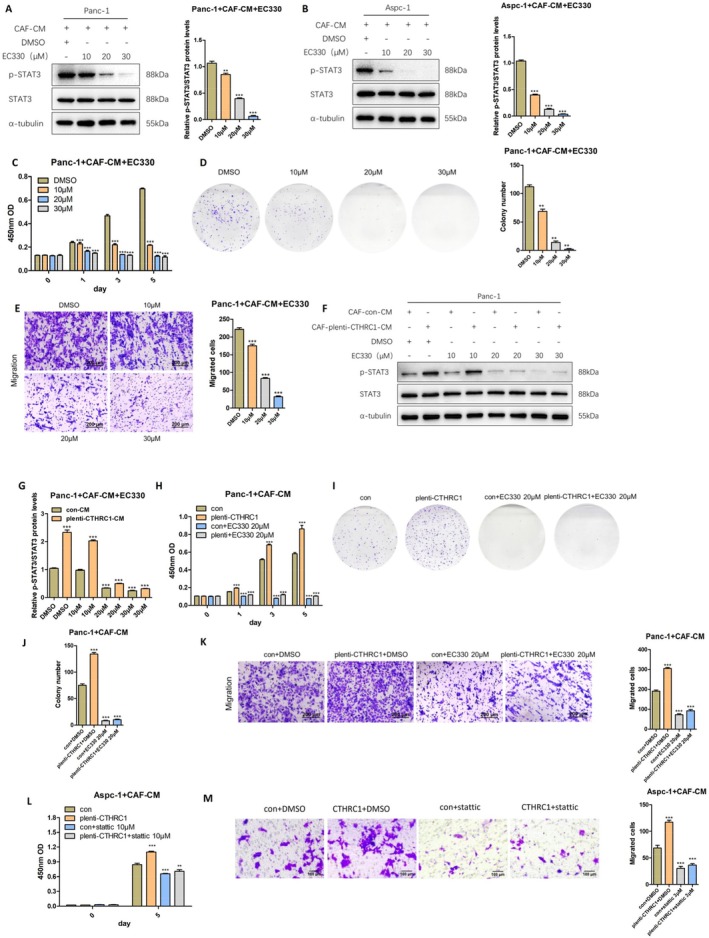
Methods: We employed multi-omics analysis combined with cellular and animal experiments to examine the association between CTHRC1 and the LIF/STAT3 pathway in pancreatic cancer clinical specimens. Using AsPC-1/PANC-1 and other cell lines, we conducted proliferation, migration, invasion, and signaling pathway studies, and elucidated the regulatory mechanism of CTHRC1 through genetic interventions and STAT3 inhibitors.

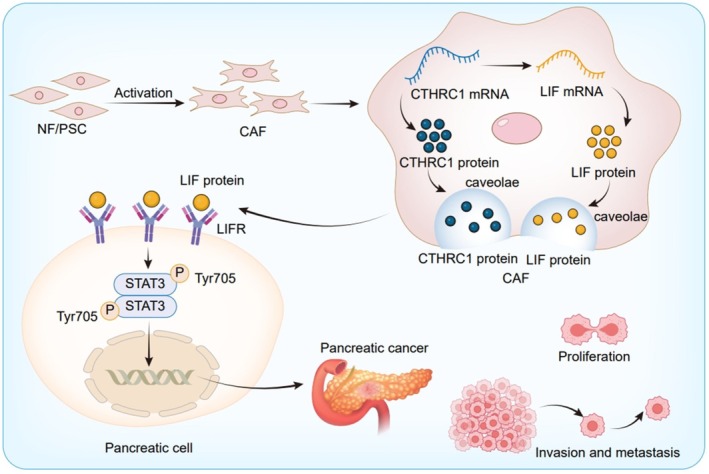
Results: In this study, we found that CTHRC1 is highly expressed in the cancer-associated fibroblasts (CAFs) of pancreatic cancer and is associated with poor prognosis in patients. Functionally, we observed that CTHRC1 in CAFs promotes the proliferation, migration, and invasion of pancreatic cancer cells both in vitro and in vivo. In mechanistic studies, RNA sequencing revealed that CTHRC1 promotes the proliferation and migration of pancreatic cancer cells through the LIF-mediated STAT3 axis.

Conclusion: These findings reveal the role of CTHRC1 in CAFs in pancreatic cancer, suggesting that it is an attractive therapeutic target and tumor marker. This study uncovers the biological mechanism of CTHRC1 in CAFs in pancreatic cancer, providing new strategies for the treatment of pancreatic cancer.

Keywords: CTHRC1; STAT3 signaling pathway; cancer‐associated fibroblast; pancreatic cancer; tumor microenvironment.


Conflict of interest statement

The authors declare no conflicts of interest.

Figures

FIGURE 1
FIGURE 1
CTHRC1 is highly expressed in CAFs of pancreatic cancer and is associated with poor prognosis of patients. (A, B) Integrated single‐cell analysis combining quantitative heatmap (A) and t‐SNE clustering (B) demonstrated CTHRC1‐specific enrichment in pancreatic cancer CAFs. (C) GEPIA database results showed that CTHRC1 was highly expressed in pancreatic cancer tissues. (D) The overall survival and disease‐free survival of patients with high CTHRC1 expression were significantly worse than those with low CTHRC1 expression. (E) The expression of CTHRC1 in CAFs, pancreatic cancer cells, and pancreatic stellate cells was detected by Western Blot. (F) Protein gray scale analysis of CTHRC1 in CAFs, pancreatic cancer cells, and pancreatic stellate cells. (G) The expression of CTHRC1 in CAFs, pancreatic cancer cells, and pancreatic stellate cells was detected by q‐PCR. (H) CTHRC1 was colocalized with CAFs in pancreatic cancer (200 μm). ***p < 0.001.
FIGURE 2
FIGURE 2
CTHRC1 in CAFs promotes proliferation and self‐renewal of pancreatic cancer cells in vitro. (A) Western blot detects the knockdown efficiency of CTHRC1 in CAFs and performs protein grayscale analysis. (B) CTHRC1 knockdown level in CAFs was measured by q‐PCR. (C) Western blot detects the overexpression level of CTHRC1 in CAFs and performs protein grayscale analysis. (D) Effect of CTHRC1 knockdown in CAFs on Panc‐1 proliferation. (E) Effect of CTHRC1 knockdown in CAFs on Aspc‐1 proliferation. (F) Effect of CTHRC1 knockdown in CAFs on Capan‐1 proliferation. (G) Effect of CTHRC1‐overexpressing CAFs on Aspc‐1 proliferation. (H) EdU fluorescence staining detects the effect of CTHRC1 knockdown in CAFs on Aspc‐1 proliferation (100 μm). (I) Effect of CTHRC1 knockdown in CAFs on the colony‐forming ability of Aspc‐1. (J) Effect of CTHRC1‐overexpressing CAFs on the colony‐forming ability of Aspc‐1. (K) Sphere formation assay detects the effect of CTHRC1 knockdown in CAFs on stemness‐related phenotypes in Panc‐1 cells. *p < 0.05; **p < 0.01; ***p < 0.001.
FIGURE 3
FIGURE 3
CTHRC1 in CAFs promotes the migration and invasion functions of pancreatic cancer cells in vitro. (A) Effect of CTHRC1 knockdown CAFs on the migration function of Panc‐1 (200 μm). (B) Effect of CTHRC1 knockdown CAFs on the migration function of Aspc‐1 (200 μm). (C) Effect of CTHRC1 knockdown CAFs on the invasion function of Aspc‐1 (200 μm). (D) Effect of CAFs overexpressing CTHRC1 on the migration function of Aspc‐1 (200 μm). (E) Effect of CAFs overexpressing CTHRC1 on the invasion function of Aspc‐1 (200 μm). (F) Effect of CTHRC1 knockdown CAFs on the wound healing function of Aspc‐1 (200 μm). (G) Effect of CAFs overexpressing CTHRC1 on the wound healing function of Aspc‐1 (200 μm). **p < 0.01; ***p < 0.001.
FIGURE 4
FIGURE 4
CTHRC1 in CAFs promotes the proliferation, migration, and invasion functions of pancreatic cancer cells in vivo. (A) Effect of CTHRC1 knockdown in CAFs on pancreatic cancer cell proliferation in vivo. (B) Analysis of tumor weight and volume in mice. (C) Representative images and quantitative analysis of in vivo imaging in mice. (D) Effect of CTHRC1 knockdown in CAFs on mouse liver metastasis and statistical analysis of the metastasis rate. (E) Effect of CTHRC1 knockdown in CAFs on mouse intestinal metastasis and statistical analysis of the metastasis rate. (F) Effect of CTHRC1 knockdown in CAFs on mouse peritoneal metastasis and statistical analysis of the metastasis rate. *p < 0.05; **p < 0.01.
FIGURE 5
FIGURE 5
CTHRC1 in CAFs positively regulates the expression level of LIF. (A) RNA‐sequence was used to analyze the enrichment of differentially expressed genes regulated by CTHRC1 after knocking down CTHRC1 in CAFs. (B) RNA‐sequence was used to analyze the enrichment of gene signaling pathways regulated by CTHRC1. (C) Map of differentially expressed genes regulated by CTHRC1. (D) Western Blot was used to detect the expression of CTHRC1 and LIF in the sample of RNA‐sequence CAFs and protein gray scale analysis. (E) q‐PCR was used to detect the expression of LIF in the sample of RNA‐sequence CAFs. (F) Spearman correlation analysis combined with TCGA database was used to analyze the correlation between CTHRC1 and LIF. (G) Western Blot was used to detect the expression of LIF in CAFs, pancreatic cancer cell lines, HPSC, and protein gray scale analysis. (H) Western Blot was used to detect the expression of LIF in CTHRC1 knockdown CAFs and protein gray scale analysis. (I) Western Blot was used to detect the expression of LIF in CAFs overexpressing CTHRC1 and protein gray scale analysis. (J) Western Blot was used to detect the expression of CTHRC1 and LIF after the CAFs with CTHRC1 knockdown were reconstructed and overexpressed and protein gray scale analysis. *p < 0.05; **p < 0.01; ***p < 0.001.
FIGURE 6
FIGURE 6
CTHRC1 in CAFs positively regulates the activation of STAT3 pathway in pancreatic cancer cells. (A) Western Blot was used to detect the activation of STAT3 signaling pathway after coculture of reconstructed CAFs‐CM with CTHRC1 overexpression and protein gray scale analysis. (B) Effect of CTHRC1 reconstructed and overexpressed CAFs on the colony‐forming ability of Panc‐1. (C) Effect of CTHRC1 reconstructed and overexpressed CAFs on the migration function of Panc‐1 (200 μm). (D) Western Blot was used to detect the expression of E‐cadherin and Vimentin after coculture of reconstructed CAFs‐CM with CTHRC1 overexpression and protein gray scale analysis. (E) Western Blot was used to detect the activation of STAT3 signaling pathway after coculture of HPSC‐CM and CAFs‐CM with Panc‐1, Aspc‐1, Capan‐1, and protein gray scale analysis. (F) Western Blot was used to detect the activation of STAT3 signaling pathway after coculture of CTHRC1 knockdown CAFs‐CM with Panc‐1, Aspc‐1, Capan‐1, and protein gray scale analysis. (G) Western Blot was used to detect the activation of STAT3 signaling pathway after coculture of CAFs‐CM overexpressing CTHRC1 with Panc‐1, Aspc‐1, Capan‐1, and protein gray scale analysis. ***p < 0.001.
FIGURE 7
FIGURE 7
CTHRC1 in CAFs mediates the activation of STAT3 signaling pathway in pancreatic cancer cells by positively regulating LIF. (A) Western Blot was used to detect the activation of STAT3 signaling pathway in Panc‐1 after adding EC330 in CAFs‐CM and protein gray scale analysis. (B) Western Blot was used to detect the activation of STAT3 signaling pathway in Aspc‐1 after adding EC330 in CAFs‐CM and protein gray scale analysis. (C) Effect of CAFs‐CM on the proliferation function of Panc‐1 after adding EC330. (D) Effect of CAFs‐CM on the colony‐forming function of Panc‐1 after adding EC330. (E) Effect of CAFs‐CM on the migration function of Panc‐1 after adding EC330. (F, G) Western Blot was used to detect the activation of STAT3 signaling pathway in Panc‐1 after adding EC330 in CAFs‐CM overexpressing CTHRC1 and protein gray scale analysis. (H) Effect of CAFs‐CM overexpressing CTHRC1 on the proliferation function of Panc‐1 after adding EC330. (I, J) Effect of CAFs‐CM overexpressing CTHRC1 on the colony‐forming function of Panc‐1 after adding EC330. (K) Effect of CAFs‐CM overexpressing CTHRC1 on the migration function of Panc‐1 after adding EC330. (L) Effect of CAFs‐CM on the proliferative function of Aspc‐1 after adding Stattic. (M) Effect of CAFs‐CM overexpressing CTHRC1 on the migration function of Aspc‐1 after adding Stattic. **p < 0.01; ***p < 0.001.
FIGURE 8
FIGURE 8
Schematic illustration of CAFs‐derived CTHRC1 promotes pancreatic cancer development and metastasis, cell migration, and tumor metastasis through the LIF‐STAT3 axis. CTHRC1 in CAFs can positively regulate the expression of LIF, thereby mediating the activation of the STAT3 signaling pathway in pancreatic cancer cells and promoting the proliferation and migration functions of pancreatic cancer cells.

Similar articles

References

    1. Stoffel E. M., Brand R. E., and Goggins M., “Pancreatic Cancer: Changing Epidemiology and New Approaches to Risk Assessment, Early Detection, and Prevention,” Gastroenterology 164, no. 5 (2023): 752–765. - PMC - PubMed
    1. Yu J., Yang X., He W., and Ye W., “Burden of Pancreatic Cancer Along With Attributable Risk Factors in Europe Between 1990 and 2019, and Projections Until 2039,” International Journal of Cancer 149, no. 5 (2021): 993–1001. - PubMed
    1. Huang J., Lok V., Ngai C. H., et al., “Worldwide Burden of, Risk Factors for, and Trends in Pancreatic Cancer,” Gastroenterology 160, no. 3 (2021): 744–754. - PubMed
    1. Wood L. D. and Hruban R. H., “Pathology and Molecular Genetics of Pancreatic Neoplasms,” Cancer Journal 18, no. 6 (2012): 492–501. - PMC - PubMed
    1. Klein A. P., “Pancreatic Cancer Epidemiology: Understanding the Role of Lifestyle and Inherited Risk Factors,” Nature Reviews Gastroenterology & Hepatology 18, no. 7 (2021): 493–502. - PMC - PubMed

MeSH terms

LinkOut - more resources