. 2025 Sep;45(9):e70260.
doi: 10.1111/liv.70260.

Pharmacological Inhibition of c-Jun N-Terminal Kinase Activity Exacerbates Liver Damage in Schistosoma mansoni Infected Mice

Affiliations

Pharmacological Inhibition of c-Jun N-Terminal Kinase Activity Exacerbates Liver Damage in Schistosoma mansoni Infected Mice

Frederik Stettler et al. Liver Int. 2025 Sep.

Abstract

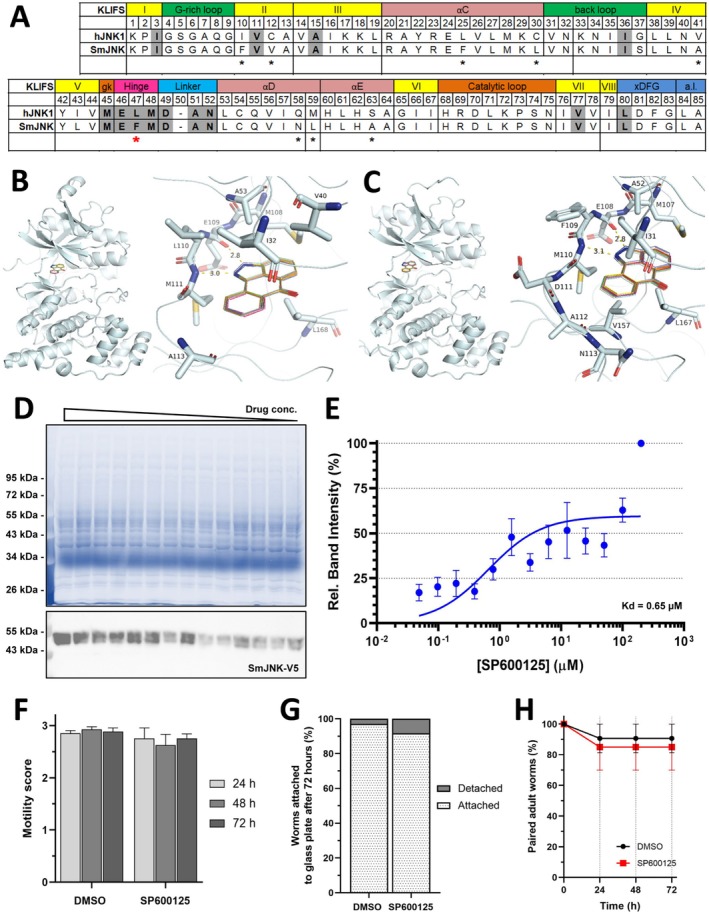
Background and aims: Schistosomiasis is a neglected tropical disease affecting more than 250 million people worldwide. Eggs of the parasitic helminth S. mansoni cause major morbidity in the liver, spleen and intestine. Of note, egg-released soluble antigens (SEA) induce the transcription factor c-Jun in hepatocytes, promoting hepatocellular cell cycle activity, proliferation and apoptosis. In this study, we analysed the hepatic effect of pharmacological inhibition of c-Jun N-terminal kinase (JNK) after infection with S. mansoni. The JNK inhibitor SP600125 was chosen because it had no effect on schistosome viability.

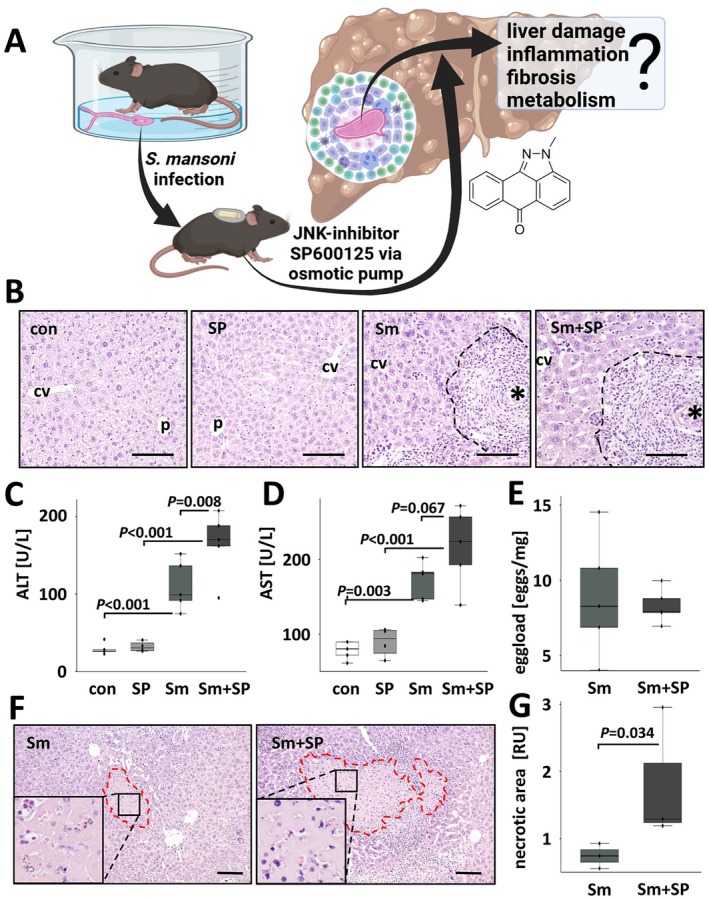
Methods: Eight-week-old male mice were infected with 100 cercariae (♂ + ♀) and 6 weeks later treated with SP600125 via a subcutaneously implanted osmotic pump over 3 weeks. Hepatic damage, inflammation, fibrosis and metabolic aspects were analysed in liver and spleen tissue as well as in serum samples.

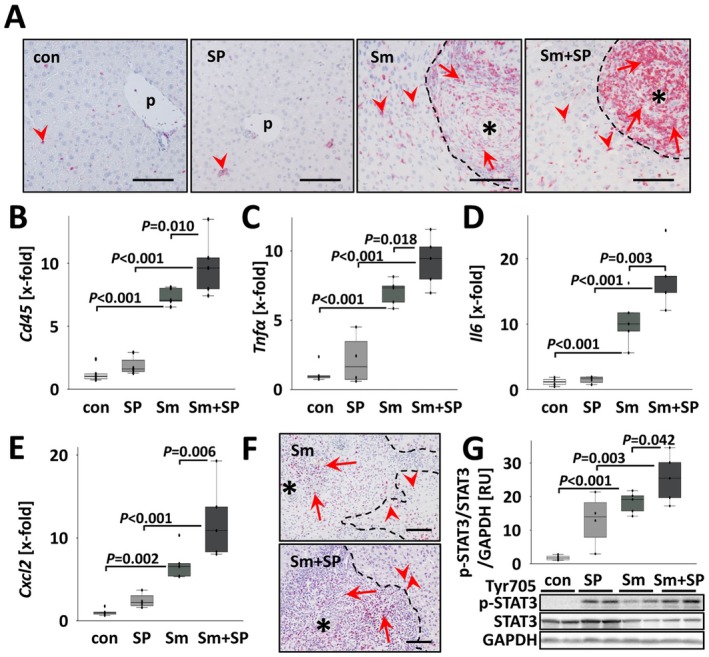
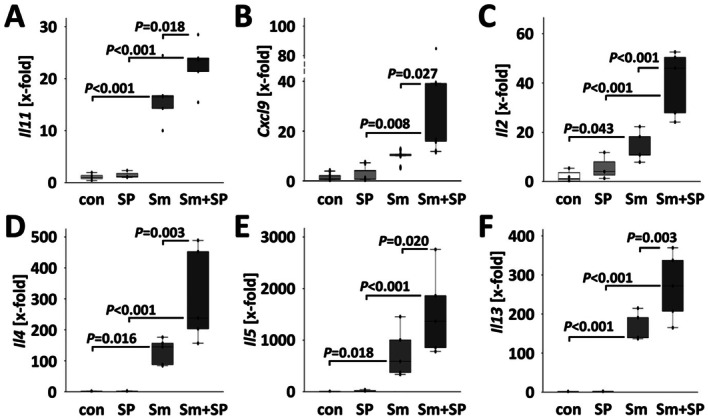
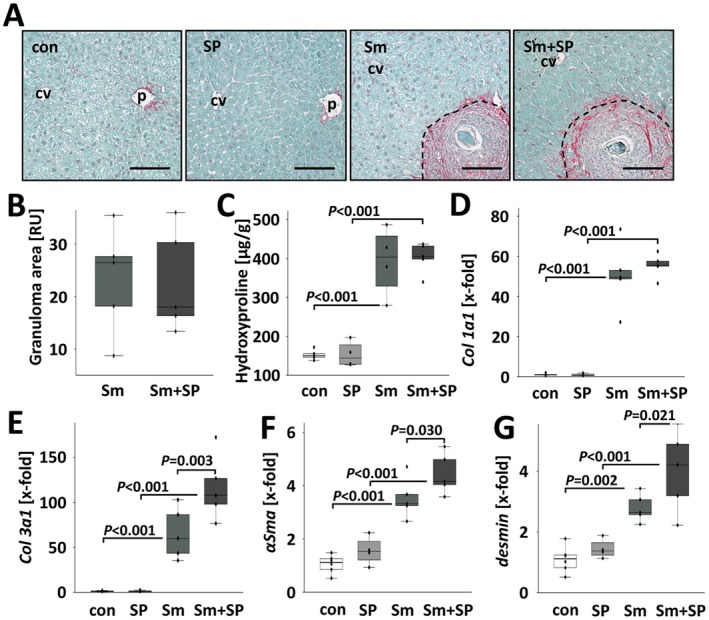
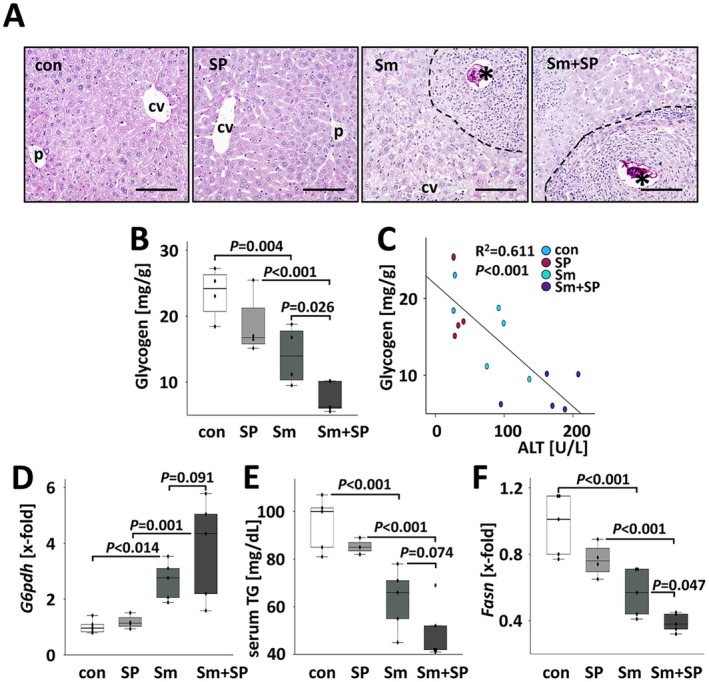
Results: JNK inhibitor-treated mice infected with S. mansoni showed a parasite-induced elevation of serum aminotransferases. Hepatic inflammation, the activation of hepatic stellate cells and metabolic exhaustion were observed in infected control mice. Additional SP600125 application almost doubled enhanced transaminases, hepatic cytokine expression, inflammation, necrosis, as well as HSC activation, and decreased glycogen stores to a minimum.

Conclusions: Our findings suggest a protective role of JNK/c-Jun-signalling in hepatic inflammation, hepatic stellate cell activation, and metabolic exhaustion during S. mansoni infection.

Keywords: SP600125; fibrosis; glycogen exhaustion; parasite; schistosomiasis.


Conflict of interest statement

The authors declare no conflicts of interest.

Figures

FIGURE 1
FIGURE 1
Binding of SP600125 to SmJNK showed no significant influence on S. mansoni motility, attachment and pairing. (A) Comparison of KLIFS residues within specified domains of hJNK1 and SmJNK protein sequences. Shaded residues indicate confirmed ligand‐target interactions between SP600125 and hJNK1. Asterisks indicate divergent residues. (B, C) Ribbon representation of hJNK1 (B) or SmJNK (C) with top 10 best scoring binding poses of SP600125. Zoomed region shows residues with side chains within 4 Å of distance to the ligand. Two hydrogen bonds are represented by dashed lines with distance in Å. (D, E) Isothermal dose–response fingerprint for intracellular SmJNK performed by cellular thermal‐shift assay. Quantification was performed by SDS‐PAGE/western blot (D) directed toward SmJNK using anti‐V5‐HRP conjugated antibody (1:5000). After quantification, the relative band intensities were plotted (E) as a function of ligand concentration to generate the fitted curve. SDS‐PAGE and western blot images are representative of the analysis of five independent experiments. Plotted data were given as average ± SEM, and the solid line represents the best fit of the data to the saturation binding curve model. (F–H) In vitro treatment of S. mansoni adult worms with 10 μM SP600125 for 3 days. 0.2% DMSO was used as control. Worms were scored for motility (F), attachment to the plate (G) and pairing status (H). In total, five worm couples per well (n = 3) were treated with the inhibitor or vehicle only (DMSO) for 3 days.
FIGURE 2
FIGURE 2
SP600125 exacerbates liver damage in S. mansoni ‐infected mice. (A) Schematic visualisation of the animal experiment and the addressed hypothesis, created with BioRender.com. (B) H&E staining visualised the granulomatous alterations in the liver of S. mansoni ‐infected mice. Black dashed line: Granuloma, *: S. mansoni egg, p: portal field, cv: central vein. Bars: 100 μm. Representative liver slices stained with H&E are shown. Enlarged pictures in Figure S4. Images of HE staining with a lower magnification to allow a more comprehensive visualisation of the hepatic tissue are shown in Figure S5. (C, D) JNK inhibitor (SP600125) treatment enhanced S. mansoni ‐induced serum ALT and AST levels. (E) Hepatic egg load was not affected by systemic JNK inhibition (Figure S6; visualisation of eggs in KOH‐digested liver). (F, G) Parenchymal necrosis was observed in three mice in each of the Sm and Sm + SP groups. Morphometric quantification of necrotic area in H&E‐stained tissue sections demonstrated expanded necrotic areas in S. mansoni ‐infected and SP600125‐treated mice. Bars: 100 μm. Representative liver slices stained with H&E are shown. Red dashed line: Border of necrotic area, the indicated area in the box was magnified in the lower left of each panel. Magnifications of microscopic images are shown in Figure S7. White bars: Uninfected control mice (con, n = 5; serum sampling failed in one case), light grey bars: SP600125‐treated mice (SP, n = 4) grey bars: S. mansoni ‐infected mice (Sm n = 5) and dark grey bars: S. mansoni ‐infected and SP600125 treated (Sm + SP, n = 5). The indicated p‐values were calculated by ANOVA and post hoc pairwise comparison of groups using Fisher's LSD or Levene's t‐test.
FIGURE 3
FIGURE 3
SP600125 increased hepatic inflammation in S. mansoni infected mice. (A) CD45 immunostaining visualised an immense hepatic infiltration of CD45+ leukocytes, especially in the granulomas (arrows) of inhibitor‐treated animals, but also into the parenchyma (arrowheads). p: portal field, *: S. mansoni egg. Bars: 100 μm. Magnifications of microscopic images are shown in Figure S11. (B) The quantification of hepatic Cd45 expression revealed an additional increase of Cd45 levels by SP600125 treatment in S. mansoni ‐infected mice. (C–E) The S. mansoni ‐induced expression of inflammatory cytokines Tnfα, Il6 and Cxcl2 was boosted by SP600125 treatment. (F) p‐STAT3 immunostaining revealed STAT3 activation inside the granulomas (arrows) but also in hepatocytes in direct vicinity (arrowheads). *: S. mansoni eggs, dashed line: Border of granulomas. Bars: 100 μm. Magnifications of microscopic images are shown in Figure S13. (G) Western blotting demonstrated a stronger hepatic activation of S. mansoni ‐induced STAT3 in SP600125‐treated mice. White bars: Uninfected control mice (con, n = 6), light grey bars: SP600125‐treated mice (SP, n = 4) grey bars: S. mansoni ‐infected mice (Sm, n = 5) and dark grey bars: S. mansoni ‐infected and SP600125 treated (Sm + SP, n = 5). The indicated p‐values were calculated by ANOVA and post hoc pairwise comparison of groups using Fisher's LSD.
FIGURE 4
FIGURE 4
SP600125 increased hepatic cytokine expression in S. mansoni ‐infected mice. (A–F) Quantitative RT‐PCR demonstrated the additional increase of S. mansoni egg‐induced cytokines Il11, Cxcl9, Il2, Il4, Il5 and Il13 by SP600125. White bars: Uninfected control mice (con, n = 6), light grey bars: SP600125‐treated mice (SP, n = 4) grey bars: S. mansoni ‐infected mice (Sm, n = 5) and dark grey bars: S. mansoni ‐infected and SP600125 treated (Sm + SP, n = 5). The indicated p‐values were calculated by ANOVA and post hoc pairwise comparison of groups using Fisher's LSD.
FIGURE 5
FIGURE 5
SP600125 promoted HSC transdifferentiation in S. mansoni ‐infected mice. (A) Sirius Red‐staining visualised the hepatic distribution of fibrillary collagens in red. Dashed line: Border of granulomas. Bars: 100 μm. Magnifications of microscopic images are shown in Figure S17. (B–D) Granuloma area, the increase of hepatic hydroxyproline, and hepatic Col1a1 expression were similar in both groups of S. mansoni ‐infected animals. (E–G) S. mansoni eggs‐induced expression levels of Col3a1, αSMA and Desmin further boosted by additional treatment with SP600125. White bars: Uninfected control mice (con, n = 6), light grey bars: SP600125‐treated mice (SP, n = 4) grey bars: S. mansoni ‐infected mice (Sm, n = 5) and dark grey bars: S. mansoni ‐infected and SP600125 treated (Sm + SP, n = 5). The indicated p‐values were calculated by ANOVA and post hoc pairwise comparison of groups using Fisher's LSD. p values are indicated.
FIGURE 6
FIGURE 6
SP600125 exacerbated the exhaustion of hepatic glycogen stores in S. mansoni ‐infected mice. (A) PAS staining visualised glycogen exhaustion in the parenchyma and glycogen enrichment in the eggs of livers of S. mansoni ‐infected mice. Dashed line: Border of granuloma. Bars: 100 μm, *: Eggs. Magnifications of microscopic images are shown in Figure S19. (B) The quantity of glycogen in the liver was reduced in both groups of S. mansoni ‐infected mice, but most strongly in Sm + SP‐treated animals. Due to the material consuming analysis and its excellent reproducibility, glycogen quantification was performed once only with n = 4–5 representative samples of each group. (C) The amount of hepatic glycogen inversely correlated with the serum ALT levels. (D) Hepatic G6pdh expression was enhanced in S. mansoni ‐infected animals. (E) Serum triglyceride levels were reduced in S. mansoni ‐infected animals. (F) Hepatic expression of fatty acid synthase (Fas) was reduced in S. mansoni ‐infected animals. This effect was enhanced in mice additionally treated with SP600125. White bars: Uninfected control mice (con, n = 6), light grey bars: SP600125‐treated mice (SP, n = 4) grey bars: S. mansoni ‐infected mice (Sm, n = 5) and dark grey bars: S. mansoni ‐infected and SP600125 treated (Sm + SP, n = 5). The indicated p‐values were calculated by ANOVA and post hoc pairwise comparison of groups using Fisher's LSD.

Similar articles

References

    1. WHO , “Schistosomiasis Fact Sheet, 02_2023,” 2023, https://www.who.int/news‐room/fact‐sheets/detail/schistosomiasis.
    1. McManus D. P., Dunne D. W., Sacko M., Utzinger J., Vennervald B. J., and Zhou X.‐N., “Schistosomiasis,” Nature Reviews Disease Primers 4, no. 1 (2018): 13. - PubMed
    1. Salas‐Coronas J., Bargues M. D., Lozano‐Serrano A. B., et al., “Evidence of Autochthonous Transmission of Urinary Schistosomiasis in Almeria (Southeast Spain): An Outbreak Analysis,” Travel Medicine and Infectious Disease 44 (2021): 102165. - PubMed
    1. Webster B. L., Southgate V. R., and Littlewood D. T. J., “A Revision of the Interrelationships of Schistosoma Including the Recently Described Schistosoma guineensis ,” International Journal for Parasitology 36, no. 8 (2006): 947–955. - PubMed
    1. Dunne D. W., Lucas S., Bickle Q., et al., “Identification and Partial Purification of an Antigen (Omega 1) From <styled-content style="fixed-case"> Schistosoma mansoni </styled-content> Eggs Which Is Putatively Hepatotoxic in T‐Cell Deprived Mice,” Transactions of the Royal Society of Tropical Medicine and Hygiene 75, no. 1 (1981): 54–71. - PubMed

MeSH terms

LinkOut - more resources