

Modeling rare genetic disease with patient-derived induced pluripotent stem cells: reassessment of the minimum numbers of lines needed
- PMID: 40751518
- PMCID: PMC12317316
- DOI: 10.1093/stcltm/szaf032
Modeling rare genetic disease with patient-derived induced pluripotent stem cells: reassessment of the minimum numbers of lines needed
Abstract
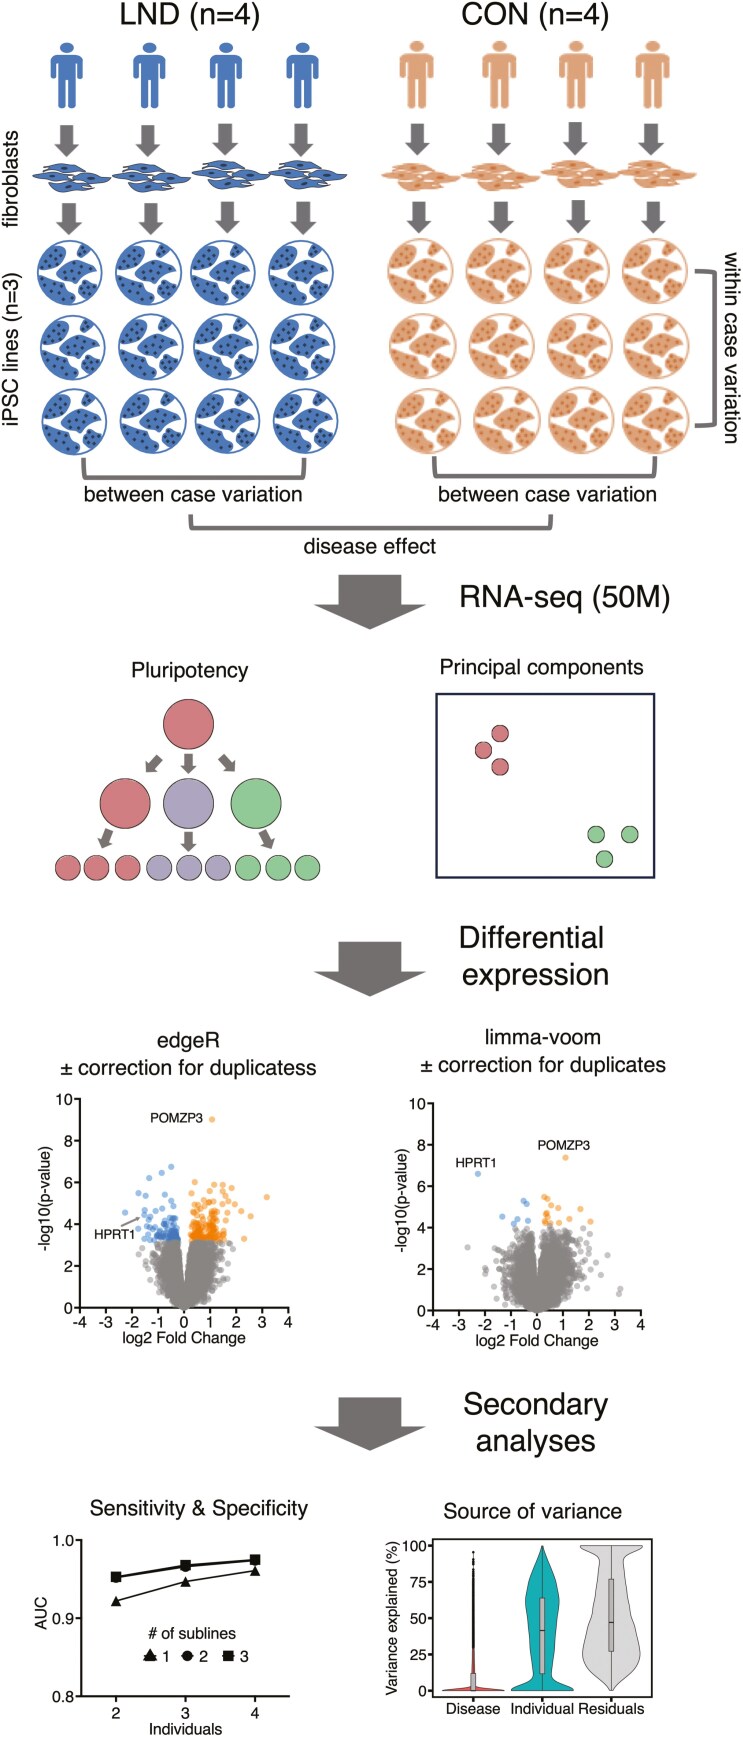
Induced pluripotent stem cells (iPSCs) are widely used to model human genetic diseases. The most common strategy involves collecting cells from relevant individuals and then reprogramming them into iPSCs. This strategy is very powerful, but finding enough individuals with a specific genetic disease can be challenging, especially since most are rare. In addition, making numerous iPSC lines is time-consuming and expensive. As a result, most studies have included relatively small numbers of iPSC lines, sometimes from the same individual. Considering the experimental variability obtained using different iPSC lines, there has been great interest in delineating the most efficient number of lines needed to achieve a robust and reproducible result. Several recommendations have been published, although most conclusions have been based on methods where experimental variance from individual cases is difficult to separate from technical issues related to the preparation of iPSCs. The current study used gene expression profiles determined by RNA sequencing (RNAseq) to empirically evaluate the impact of the number of unique individuals and the number of replicate iPSC lines from each individual for modeling Lesch-Nyhan disease (LND). This disease is caused by mutations in the HPRT1 gene, which encodes the enzyme hypoxanthine-guanine phosphoribosyltransferase. Results for detecting disease-relevant changes in gene expression depended on the analytical method employed, and whether or not statistical procedures were used to address multiple iPSC lines from the same individual. In keeping with prior studies, the best results were obtained with iPSC lines from 3-4 unique individuals per group. In contrast to prior studies, results were improved with 2 lines per individual, without statistical corrections for duplicate lines from the same individual. In the current study where all lines were produced in parallel using the same methods, most variance in gene expression came from technical factors unrelated to the individual from whom the iPSC lines were prepared.
Keywords: HPRT1; Lesch–Nyhan disease; disease modeling; human; induced pluripotent stem cell; transcriptome.
© The Author(s) 2025. Published by Oxford University Press.
Conflict of interest statement
The authors declare no competing interests.
Figures


Similar articles
-
A rapid and systematic review of the clinical effectiveness and cost-effectiveness of paclitaxel, docetaxel, gemcitabine and vinorelbine in non-small-cell lung cancer.Health Technol Assess. 2001;5(32):1-195. doi: 10.3310/hta5320. Health Technol Assess. 2001. PMID: 12065068
-
The clinical effectiveness and cost-effectiveness of enzyme replacement therapy for Gaucher's disease: a systematic review.Health Technol Assess. 2006 Jul;10(24):iii-iv, ix-136. doi: 10.3310/hta10240. Health Technol Assess. 2006. PMID: 16796930
-
Can a Liquid Biopsy Detect Circulating Tumor DNA With Low-passage Whole-genome Sequencing in Patients With a Sarcoma? A Pilot Evaluation.Clin Orthop Relat Res. 2025 Jan 1;483(1):39-48. doi: 10.1097/CORR.0000000000003161. Epub 2024 Jun 21. Clin Orthop Relat Res. 2025. PMID: 38905450
-
Falls prevention interventions for community-dwelling older adults: systematic review and meta-analysis of benefits, harms, and patient values and preferences.Syst Rev. 2024 Nov 26;13(1):289. doi: 10.1186/s13643-024-02681-3. Syst Rev. 2024. PMID: 39593159 Free PMC article.
-
Signs and symptoms to determine if a patient presenting in primary care or hospital outpatient settings has COVID-19.Cochrane Database Syst Rev. 2022 May 20;5(5):CD013665. doi: 10.1002/14651858.CD013665.pub3. Cochrane Database Syst Rev. 2022. PMID: 35593186 Free PMC article.
References
-
- Rowe RG, Daley GQ.. Induced pluripotent stem cells in disease modelling and drug discovery. Nat Rev Genet. 2019;20:377-388. https://doi.org/ 10.1038/s41576-019-0100-z - DOI - PMC - PubMed
-
- Freel BA, Sheets JN, Francis KR.. iPSC modeling of rare pediatric disorders. J Neurosci Methods. 2020;332:108533. https://doi.org/ 10.1016/j.jneumeth.2019.108533 - DOI - PMC - PubMed
-
- Nicholson MW, Ting CY, Chan DZH, et al. Utility of iPSC-derived cells for disease modeling, drug development, and cell therapy. Cells 2022;11:1853. https://doi.org/ 10.3390/cells11111853 - DOI - PMC - PubMed
-
- Germain PL, Testa G.. Taming human genetic variability: Transcriptomic meta-analysis guides the experimental design and interpretation of iPSC-based disease modeling. Stem Cell Rep. 2017;8:1784-1796. https://doi.org/ 10.1016/j.stemcr.2017.05.012 - DOI - PMC - PubMed
-
- Brunner JW, Lammertse HCA, van Berkel AA, et al. Power and optimal study design in iPSC-based brain disease modelling. Mol Psychiatry. 2023;28:1545-1556. https://doi.org/ 10.1038/s41380-022-01866-3 - DOI - PMC - PubMed
MeSH terms
Grants and funding
LinkOut - more resources
Full Text Sources
Medical
Research Materials
Miscellaneous
