. 2025 Aug 2;16(1):7094.
doi: 10.1038/s41467-025-62299-4.

Neural function of Netrin-1 in precancerous lesions of the pancreas

Affiliations

Neural function of Netrin-1 in precancerous lesions of the pancreas

Hiba Haidar et al. Nat Commun. .

Abstract

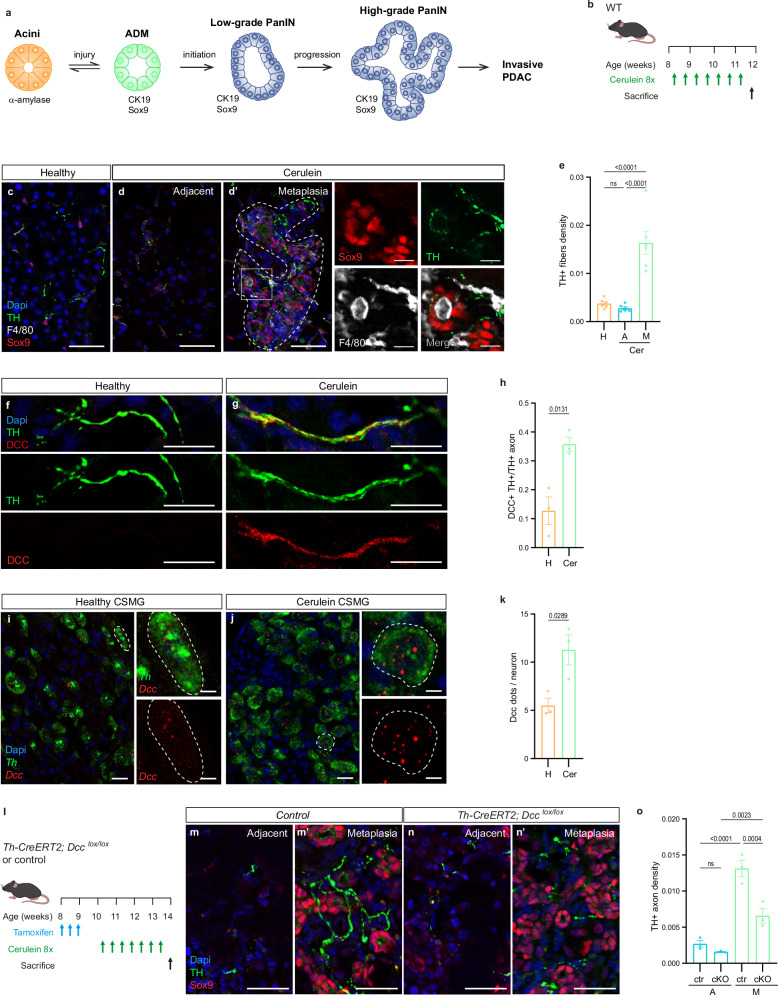
The nervous system undergoes dynamic structural remodeling to infiltrate cancerous tumors, contributing to their growth and progression. Emerging evidence indicates that neuroplasticity initiates early, with nerve terminals detecting and responding to tissue changes even during precancerous stages. Notably, dense sympathetic axon sprouting has been observed around pancreatic intraepithelial neoplasia (PanIN), a common precursor lesion to pancreatic cancer. However, the molecular signals driving this early neuroplasticity and its functional consequences remain poorly understood. Here, we identify the axon guidance molecule Netrin-1 as a key factor secreted by pancreatic cells within precursor lesions of pancreatic cancer. Netrin-1 promotes sympathetic axon growth and branching through its receptor, Deleted in Colorectal Cancer (DCC). Inhibition of Netrin-1 disrupts sympathetic axon remodeling while accelerating PanIN formation and progression, driven by increased precancerous cell proliferation. Furthermore, human pancreatic tissue analysis corroborates Netrin-1 expression in precursor lesions. These findings suggest that Netrin-1-driven sympathetic neuroplasticity plays a protective role in the precancerous microenvironment by modulating local cellular dynamics, providing insights into early cancer progression.


Conflict of interest statement

Competing interests: P.M. is a shareholder of Netris Pharma. The other authors declare no competing interests.

Figures

Fig. 1
Fig. 1. Sympathetic remodeling in metaplastic pancreatic lesions requires DCC.
a Schematic of pancreatic ductal adenocarcinoma (PDAC) progression. Acinar cells undergo acinar-to-ductal metaplasia (ADM) during injury or inflammation, marked by Sox9 or Cytokeratin (CK) 19 expression. While ADM is reversible, oncogenic Kras mutations (e.g., G12D) drive its progression to pancreatic intraepithelial neoplasia (PanIN), a precancerous stage with varying degrees of neoplasia, from low to high-grade carcinoma in situ. b Protocol for ADM induction. Mice received 8 hourly cerulein injections per treatment day. Samples were collected 2 days after the final injection. c, d Immunohistochemistry (IHC) for TH (sympathetic neurons) and F4/80 (macrophages) in healthy and cerulein-treated pancreas. Metaplastic lesions are marked by Sox9. Scale bars: 50 µm; insets, 10 µm. e Quantification of TH+ axon density in healthy pancreas (H), metaplastic lesions (M), and adjacent tissue (A) from cerulein-treated mice (Cer). Data: mean ± SEM. n = 6 mice/group; 36 (H), 31 (A), 44 (M) ROIs analyzed. One-way ANOVA. f, g IHC for TH and DCC in healthy and cerulein-treated pancreas. Scale bar: 20 µm. h Quantification of TH+ axons co-expressing DCC in healthy (H) and cerulein-treated (Cer) pancreas. Data: mean ± SEM. n  =  3 mice/group; 20 sections analyzed per group. Unpaired t-test, two-tailed. i, j RNAscope for Th and Dcc mRNA in celiac superior mesenteric ganglia (CSMG) of healthy and cerulein-treated mice. Scale bars: 20 µm; insets, 5 µm. k Quantification of Dcc mRNA in CSMG neurons from healthy (H) and cerulein-treated (Cer) mice. Data: mean ± SEM. n  =  3 mice/group; 9 (H) and 8 (Cer) sections analyzed. Unpaired t-test, two-tailed. l Experimental design for tamoxifen injection and cerulein treatment in Th-CreERT2; Dcclox/lox mice and Cre-negative controls. m, n IHC for TH and Sox9 in metaplastic lesions (m’, n’) and adjacent tissue (m, n) from cerulein-treated control and Th-CreERT2; Dcclox/lox mice. Scale bar: 25 µm. o Quantification of TH+ axon density in metaplastic lesions (M) and adjacent tissues (A) in cerulein-treated control (ctr) and Th-CreERT2; Dcclox/lox (cKO) mice. Data: mean ± SEM. n  =  3 mice/group; 21 (ctr, M), 11 (ctr, A), 23 (cKO, M), 12 (cKO, A) ROIs analyzed. One-way ANOVA. p-values are indicated in the figure (ns: p > 0.05). Source data are provided as a Source Data file.
Fig. 2
Fig. 2. Netrin-1 produced by metaplastic cells drives sympathetic axon remodeling.
ac IHC for Netrin-1 and Iba1 (macrophages) in healthy and cerulein-treated pancreas. Arrows: enlarged macrophages. Scale bars: 20 µm; insets, 5 µm. d Netrin-1 fluorescence in healthy (H), metaplastic (M) and adjacent tissues (A). Data: mean ± SEM. n = 3 mice/group; 15 (H), 20 (A), 15 (M) ROIs analyzed. One-way ANOVA. e Proportion of Iba1+ macrophages expressing Netrin-1 in healthy (H), metaplastic (M) and adjacent tissues (A). Data: mean ± SEM; n = 3 mice/group; 18 (H), 13 (A), 18 (M) ROIs analyzed. One-way ANOVA. fi TH+ CSMG neurons cultured with PBS (vehicle), Netrin-1, anti-Netrin-1 antibody or isotype control. Scale bar: 50 μm. j Neurite length normalized to Netrin-1 condition. Data: mean ± SEM. n  =  94 (vehicle), 132 (Netrin-1), 94 (Netrin-1 + αNetrin-1), and 89 (Netrin-1 + Iso-antibody) neurons; 4 experiments. Kruskal–Wallis. k Schematic of cerulein and antibody treatment. l, m 3D maximum intensity projection of TH+ axons in CK19+ metaplastic lesions from isotype (l) or anti-Netrin-1-treated (m) mice. Right panels: reconstructed axons and branch points (purple). Scale bar: 30 µm. n TH+ axon density in metaplastic lesions (M) following anti-Netrin-1 (αNet) or isotype (Iso) treatment. Data: mean ± SEM; n  =  3 mice/group; 6 ROIs analyzed per group. One-way ANOVA. o Schematic of cerulein treatment in LysM-Cre;Ntn1lox/lox mice. p, q IHC for TH and Sox9 in metaplastic (p’ and q’) and adjacent tissues (p and q) of cerulein-treated LysM-Cre;Ntn1lox/lox and control mice. Scale bar: 25 µm. r TH+ axon density in metaplastic (M) and adjacent tissues (A) of cerulein-treated control (ctr) and LysM-Cre;Ntn1lox/lox (cKO) mice. Data: mean ± SEM. n  =  3 mice/group; 13 (ctr, A), 16 (cKO, A), 25 (ctr, M), 26 (cKO, M) ROIs analyzed. One-way ANOVA. s, Schematic of cerulein treatment of Pdx1-Cre;Ntn1lox/lox mice. t, u IHC for TH and Sox9 in metaplastic (t’ and u’) and adjacent tissue (t and u) of cerulein-treated control and Pdx1-Cre;Ntn1lox/lox mice. Scale bar: 25 µm. v TH+ axon density in metaplastic (M) and adjacent tissues (A) of cerulein-treated control (ctr) and Pdx1-Cre;Ntn1lox/lox (cKO) mice. Data: mean ± SEM. n  =  3 mice/group; 15 (ctr, A), 14 (cKO, A), 28 (ctr, M), 26 (cKO, M) ROIs analyzed. One-way ANOVA. p-values are indicated in the figure (ns: p > 0.05). Source data are provided as a Source Data file.
Fig. 3
Fig. 3. Netrin-1 promotes the innervation of precancerous PanIN lesions.
ac IHC for Netrin-1 and Sox9 in asymptomatic tissue (a), PanIN lesion (b), and PDAC tumor from 6.5-week-old KIC mice. Scale bar: 50 µm. d Quantification of Netrin-1 fluorescence in adjacent tissue (A), PanIN lesions (P), and PDAC tumors (T). Data: mean ± SEM. n  =  3 mice, 16 (A), 15 (P), 16 (T) ROIs analyzed. One-way ANOVA. e, f RNAscope for Th and Dcc mRNA in celiac superior mesenteric ganglia (CSMG) from 6.5-week-old control (e) and KIC (f) mice. Scale bars: 20 µm; insets, 5 µm. g Quantification of Dcc mRNA in CSMG neurons from control (ctr) and KIC mice. Data: mean ± SEM. n  = 3 mice/group; 5 (ctr) and 6 (KIC) sections analyzed. Unpaired t-test, two-tailed. h Schematic of the experimental design for antibody treatment of KIC mice. i–l left panels: 3D maximum intensity projections of TH+ axons in PanIN lesions and adjacent tissues from isotype (i) or anti-Netrin-1-treated (k) KIC mice. Right panels: 2D optical sections of PanIN lesions identified by tissue autofluorescence (AF). j, l show reconstructed TH+ axons and branching points (purple). Scale bars: 100 µm (i, k, left panels of j and l), 20 µm (right panels of j, l). m, n TH+ axon density (m) and branching (n) in PanIN lesions (P) and adjacent tissues (A) following anti-Netrin-1 (αNet) or isotype (Iso) treatment. Data: mean ± SEM. n  =  3 mice/group; 9 ROIs analyzed per group. One-way ANOVA. p-values are indicated in the figure (ns: p > 0.05). Source data are provided as a Source Data file.
Fig. 4
Fig. 4. Netrin-1 signaling inhibits the progression of precancer PanIN lesions.
a, b 3D maximum intensity projection of CK19 immunostaining in 6.5-week-old KIC mice treated with anti-Netrin-1 antibody (αNetrin-1) or isotype control (Iso-antibody). CK19 labels both pancreatic ducts and their ramifications (asterisks), as well as PanIN lesions (arrows). Scale bar: 500 µm. c Quantification of PanIN lesions per mm3 following anti-Netrin-1 (αNet) or isotype (Iso) treatment. Data: mean ± SEM; n  =  3 mice/group; 6 (Iso) and 5 (αNet) ROIs were analyzed. Unpaired t-test, two-tailed. d, e 2D optical sections showing low- (d) and high-grade (e) PanIN lesions. PanINs were labeled with CK19, and pancreatic tissue was visualized by autofluorescence (AF). Insets: 3D maximum intensity projections of CK19+ signal. Scale bars: 100 µm (d), 200 µm (e). f Proportions of low- and high-grade PanIN lesions following anti-Netrin-1 (αNet) or isotype (Iso) treatment. n  = 3 mice/group; 20 (Iso) and 41 (αNet) PanINs analyzed. Data are shown as percentage. Chi-squared, two-tailed. g, h IHC for Sox9 and KI67 in PanIN lesions from KIC mice treated with isotype (g) or anti-Netrin-1 (h) antibodies. Scale bar: 50 µm. i Proportion of Sox9+ cells expressing KI67 in PanIN lesions following anti-Netrin-1 (αNet) or isotype (Iso) treatment. Data: mean ± SEM. n  =  3 mice/group; 20 (Iso) and 19 (αNet) PanINs analyzed. Unpaired t-test, two-tailed. j Summary of findings and proposed model: Reactivation of the neurodevelopmental Netrin-1/DCC signaling pathway promotes hyperinnervation of non-malignant pancreatic lesions by sympathetic nerve terminals. This process may initiate a negative feedback loop that restrains lesion progression to higher grades by limiting cell proliferation. p-values are indicated in the figure (ns: p > 0.05). Source data are provided as a Source Data file.
Fig. 5
Fig. 5. Netrin-1 expression in ADM and PanIN lesions in the human pancreas.
a, Uniform Manifold Approximation and Projection (UMAP) of all cells from single-nucleus RNA sequencing of two donors with chronic pancreatitis, with populations identified by color. b UMAP plot showing NTN1 expression in acinar, ductal, and tuft cell clusters. c Dot plot of NTN1 expression in acinar, ductal, and tuft cell clusters, where dot size represents the percentage of expressing cells and color indicates average expression levels. dh Immunohistochemical analysis of Netrin-1 expression in histological sections from 3 human PDAC patients, counterstained with hematoxylin. Normal (asymptomatic) tissue (d) and PanIN (f) were from a stage IB patient, while ADM (e) and PanIN (g, h) from peritumor tissues of two stage III patients. Scale bar: 100 µm.

Update of

Similar articles

References

    1. Mancusi, R. & Monje, M. The neuroscience of cancer. Nature618, 467–479 (2023). - PMC - PubMed
    1. Ayala, G. et al. Cancer-related axonogenesis and neurogenesis in prostate cancer. Clin. Cancer Res.14, 7593–7603 (2009). - PubMed
    1. Magnon, C. et al. Autonomic nerve development contributes to prostate cancer progression. Science341, 1236361 (2013). - PubMed
    1. Stopczynski, R. E. et al. Neuroplastic changes occur early in the development of pancreatic ductal adenocarcinoma. Cancer Res.74, 1718–1727 (2014). - PMC - PubMed
    1. Sinha, S. et al. PanIN neuroendocrine cells promote tumorigenesis via neuronal cross-talk. Cancer Res.77, 1868–1879 (2017). - PMC - PubMed

MeSH terms

LinkOut - more resources