. 2025 Aug 2;11(1):363.
doi: 10.1038/s41420-025-02637-z.

CDK inhibitors promote neuroblastoma cell differentiation and increase sensitivity to retinoic acid-a promising combination strategy for therapeutic intervention

Affiliations

CDK inhibitors promote neuroblastoma cell differentiation and increase sensitivity to retinoic acid-a promising combination strategy for therapeutic intervention

Fatemeh Shokraie et al. Cell Death Discov. .

Abstract

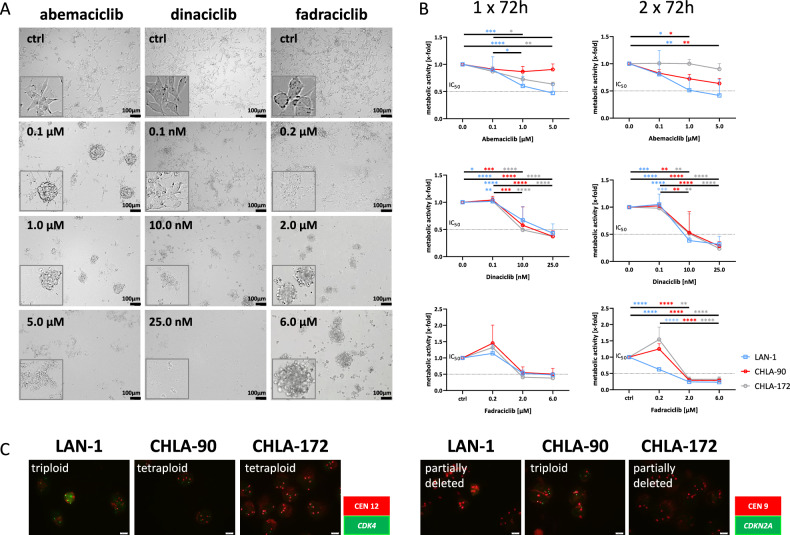
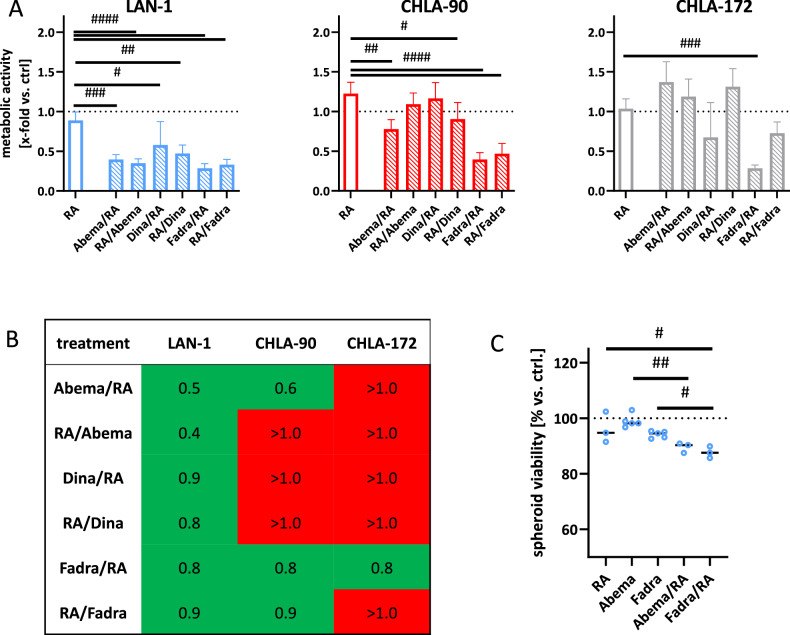
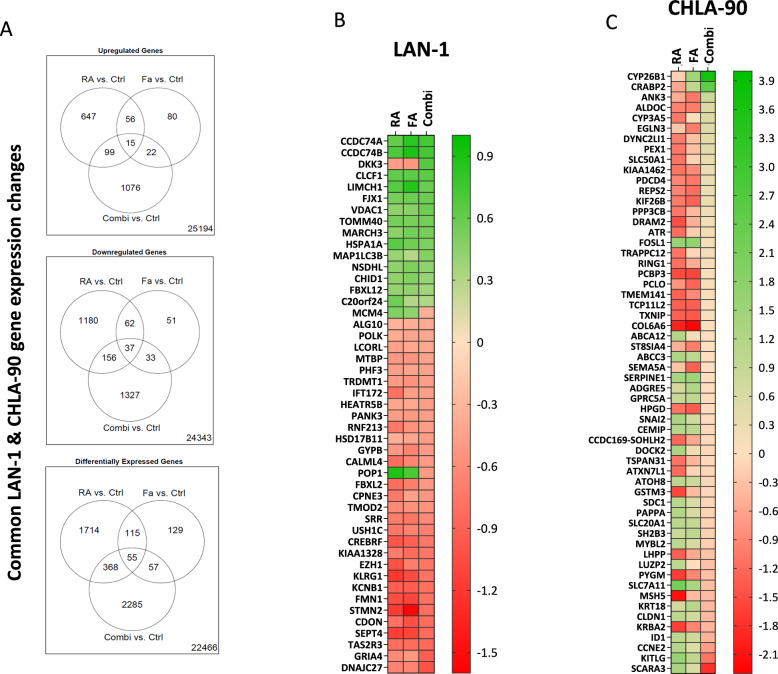
The rarity of recurrent somatic mutations poses a challenge for the targeted treatment of neuroblastoma (NB). Differentiation therapy is an encouraging prospect, with cyclin-dependent kinase inhibitors (CDKis) representing a promising avenue for promoting NB differentiation. This study investigated three CDKis (abemaciclib, fadraciclib, and dinaciclib) alone or combined with retinoic acid (RA) to assess the effects on morphology, growth, gene expression, and the induction of immunogenic cell death in NB cell lines with (LAN-1 and CHLA-90) and without (CHLA-172) MYCN amplification. All cell lines demonstrated sensitivity to CDK inhibition. Notably, low-dose abemaciclib promoted cellular differentiation, as evidenced by the emergence of stromal-like morphological features and upregulation of the differentiation markers STMN4 and ROBO2. Treatment with abemaciclib or fadraciclib led to the upregulation of calnexin and holocytochrome C, which are part of the global stress response, along with the protein p27, which arrests the cell cycle. Molecularly, CDKis sensitivity correlated with an increased CDK4-specific copy number, along with a partial deletion of CDKN2a in two cases (LAN-1, CHLA-172). The addition of RA augmented the effects of the monotherapy, particularly in LAN-1 cells, in both 2D and 3D culture, and both treatments triggered immunogenic cell death, evidenced by calreticulin translocation. Transcriptomic analysis of LAN-1 and CHLA-90 cells revealed that genes deregulated by monotherapy (fadraciclib or RA) were re-regulated in the presence of the second drug. Combination therapy significantly downregulated CRABP2 and CYP26B1, both of which are involved in RA metabolism and its degradation. Furthermore, CCNE2, MYBL2, and MCM4 were strongly suppressed in the fadraciclib/RA combination, confirming the induction of cell cycle arrest. CDKi treatments promote NB differentiation via ER stress, with cytotoxicity enhanced by RA co-treatment. This may increase NB immunogenicity and support immunotherapy eligibility.


Conflict of interest statement

Competing interests: The authors declare no competing interests.

Figures

Fig. 1
Fig. 1. Dose response curve and molecular analysis.
A, B Sensitivity of NB cells (LAN-1, CHLA-90, and CHLA-172) to abemaciclib, dinaciclib, and fadraciclib was determined after 1 × 72 h and 2 × 72 h. Cells were treated with increasing concentrations of CDKis and metabolic activity was measured using the CCK-8 reagent. A Representative images of LAN-1 cells after 1 × 72 h. Error bars: 100 µm. B Metabolic activity was quantified after the treatment by normalization to control. Mean + SD; n = 3 biological replicates. Two-way ANOVA (Tukey’s multiple comparisons test). *p < 0.05; ** p < 0.01; ***p < 0.001; ****p < 0.0001. C Cyto-FISH. Cytospins of NB cell lines were stained with the SPEC CDK4/CEN 12 Dual Color Probe or SPEC CDKN2A /CEN9 Dual Color Probe to check for gene-specific amplification of CDKN2A and CDK4. The red spots indicate the centromers and the green spots indicate the specific gene. Visualization was carried out with the fluorescence microscope Olympus BX53. Original magnification ×1000.
Fig. 2
Fig. 2. Combination approach.
A Two treatment settings were tested on NB cells (LAN-1, CHLA-90, and CHLA-172): CDKi followed by RA and the other way around. Metabolic activity after treatment was quantified by normalization to control. Mean + SD; n = 3 biological replicates. Two-way ANOVA (Tukey’s multiple comparisons test). #p < 0.05; ##p < 0.01; ###p < 0.001; ####p < 0.0001 vs. RA monotherapy. B Bliss independence calculation. CI < 1 synergistic; CI = 1 additive; CI > 1 antagonistic. C 3D-spheroid viability assessment using 3D-Glo assay. Individual values of single spheroids are shown, including the median; n = 3 biological replicates. One-way ANOVA (Tukey’s multiple comparisons test). #p < 0.05; ##p < 0.01; vs. monotherapy. AC Doses: RA (all cell lines): 1.5 µM; LAN-1 abemaciclib: 0.2 µM; dinaciclib (all cell lines): 10 nM; fadraciclib: 0.4 µM; CHLA-90/CHLA-172: abemaciclib: 1.0 µM: fadraciclib: 1 µM.
Fig. 3
Fig. 3. Immunofluorescence for detection and quantification of differentiation and stemness markers ROBO2, STMN4, and KLF4.
NB cells (LAN-1, CHLA-90, and CHLA-172) were stained with respective antibodies to detect target proteins (green), nuclei were stained with DAPI (blue). Images were taken on a Zeiss AxiovertA.1 Microscope. A Representative microscopic images of NB cells, taken on a Zeiss AxiovertA.1 Microscope. B Quantification of ROBO2, STMN4, and KLF4. Mean + SD; n = 3 biological replicates. One-way ANOVA (Tukey’s multiple comparisons test). *p < 0.05; **p < 0.01; #p < 0.05; ##p < 0.01. A, B Doses: RA (all cell lines): 1.5 µM; LAN-1 abemaciclib: 0.2 µM; fadraciclib: 0.4 µM; CHLA-90/CHLA-172: abemaciclib: 1.0 µM: fadraciclib: 1 µM.
Fig. 4
Fig. 4. Immunofluorescence for detection and quantification of cytochrome C and calnexin.
A, B NB cells (LAN-1, CHLA-90) were stained with respective antibodies to determine the subcellular localization of cytochrome C (green), and calnexin (red). The cytoskeleton was visualized using phalloidin green, nuclei were stained with DAPI (blue). Images were taken on a Zeiss AxiovertA.1 Microscope. A, B Representative single channel and merged images. C Quantification of cytochrome C and calnexin intensity. Mean + SD; n = 3 biological replicates. One-way ANOVA (Tukey’s multiple comparisons test). **p < 0.01 vs. ctrl; ##p < 0.01 vs. monotherapy. (B, C) Doses: RA (all cell lines): 1.5 µM; LAN-1 abemaciclib: 0.2 µM; fadraciclib: 0.4 µM; CHLA-90: abemaciclib: 1.0 µM: fadraciclib: 1 µM.
Fig. 5
Fig. 5. Detection of cell cycle arrest by p27 immunofluorescence and cell death by flow cytometry.
A, B p27 was detected upon staining with an Alexa Fluor® 488 anti-p27/Kip1 Antibody. A Representative microscopic images of NB cells (LAN-1, CHLA-90), taken on a Zeiss AxiovertA.1 Microscope. B p27 quantification. Mean + SD; n = 3 biological replicates. One-way ANOVA (Tukey’s multiple comparisons test). *p < 0.05. C, D Cell cycle analysis of lentivirally-transduced LAN-1 cells. C Visualization of cell cycle phases by fluorescence microscopy. D Quantification of cell cycle phases. n = 3 biological replicates. Two-way ANOVA (Tukey’s multiple comparisons test). *p < 0.05; **p < 0.01; ***p < 0.001; ****p < 0.0001 vs. ctrl. AD Doses: RA (both cell lines): 1.5 µM; LAN-1 abemaciclib: 0.2 µM; fadraciclib: 0.4 µM; CHLA-90: abemaciclib: 1.0 µM: fadraciclib: 1 µM.
Fig. 6
Fig. 6. Detection of cell cycle changes and treatment-related CalR translocation.
A, B Two-step cell cycle analysis: Cells were counted, adjusted to equal numbers, lysed, and stained with DAPI prior to measurement. DNA content was measured using the NucleoCounter® NC-3000™ system. Mean + SD; n = 3 biological replicates. One-way ANOVA (Tukey’s multiple comparisons test). *p < 0.05; ***p < 0.001; ****p < 0.0001 vs. ctrl. ##p < 0.01; ###p < 0.001; ####p < 0.0001 vs. monotherapy. C Apoptosis/necrosis assay. Flow cytometry was done to quantify the number of dead cells after 2 × 72 h treatment. Early apoptotic cells: Yo-Pro-1+/PI-, late apoptotic cells: Yo-Pro-1+/PI+, necrotic cells: Yo-Pro-1-/PI-. n = 3 biological replicates. One-way ANOVA (Tukey’s multiple comparisons test). *p < 0.05; **p < 0.01; ***p < 0.001 vs. ctrl; #p < 0.05; ##p < 0.01; ###p < 0.001 vs. monotherapy. D, E Immunogenic cell death analysis of NB cells (LAN-1, CHLA-90) was done by flow cytometry using PE anti-calreticulin antibody. D Representative flow cytometry plots of LAN-1 and CHLA-90 cells. E Quantitative analysis. AE Doses: RA (both cell lines): 1.5 µM; LAN-1 abemaciclib: 0.2 µM; fadraciclib: 0.4 µM; CHLA-90: abemaciclib: 1.0 µM: fadraciclib: 1 µM; Mean + SD; n = 3 biological replicates. One-way ANOVA (Tukey’s multiple comparisons test). *p < 0.05; ***p < 0.001; ****p < 0.0001 vs. ctrl; #p < 0.05; ##p < 0.01; ###p < 0.001; ####p < 0.0001 vs. monotherapy.
Fig. 7
Fig. 7. Microarray analysis to confirm treatment-induced changes in LAN-1 and CHLA-90 cells on a transcriptional level.
A Venn diagrams illustrate the number of genes that were differentially expressed after receiving RA (RA vs. Ctrl), fadraciclib (Fa vs. Ctrl), and the combination (Combi vs. Ctrl). Therefore, the data from the two cell lines LAN-1 and CHLA-90 were combined to eliminate the effects of the individual cell lines on the therapy. This was done to determine if the treatment itself can regulate the specific gene in both cell lines. Each circle represents the respective gene sets, with the default settings of a Benjamini–Hochberg adjusted P value < 0.05. B, C The 55 probe sets (mapping to 47 and 58 genes) in the center of the DEGs are depicted in the heatmap. B LAN-1 cells and (C) CHLA-90 cells.
Fig. 8
Fig. 8. Interaction network of genes affected by the therapy in neuroblastoma.
The nodes represent proteins encoded by corresponding genes, and the edges between them indicate known or predicted interactions. MCL clustering was implemented considering 1.3 inflation parameter. Every color corresponds to a cluster, inter-cluster edges are represented by dashed lines.

References

    1. Körber V, Stainczyk SA, Kurilov R, Henrich KO, Hero B, Brors B, et al. Neuroblastoma arises in early fetal development and its evolutionary duration predicts outcome. Nat. Genet. 2023;55:619. - PMC - PubMed
    1. Bahmad HF, Chamaa F, Assi S, Chalhoub RM, Abou-Antoun T, Abou-Kheir W. Cancer stem cells in neuroblastoma: Expanding the therapeutic frontier. Front Mol. Neurosci. 2019;12:1–17. - PMC - PubMed
    1. Pierce GB, Dixon FJ, Verney E. Testicular teratomas. I. Demonstration of teratogenesis by metamorphosis of multipotential Cells. Cancer. 1959;12:573–83. - PubMed
    1. Frankel SR, Eardley A, Heller G, Berman E, Miller WH, Dmitrovsky E, et al. All-trans retinoic acid for acute promyelocytic leukemia: results of the New York study. Ann Intern Med. 1994;120:278–86. - PubMed
    1. Bruno G, Cencetti F, Pini A, Tondo A, Cuzzubbo D, Fontani F, et al. β3-adrenoreceptor blockade reduces tumor growth and increases neuronal differentiation in neuroblastoma via SK2/S1P2 modulation. Oncogene. 2020;39:368–84. - PMC - PubMed