. 2025 Aug 2;16(1):7116.
doi: 10.1038/s41467-025-62543-x.

Chimeric exosomes-derived immunomodulator restoring lymph nodes microenvironment for sensitizing TNBC immunotherapy

Affiliations

Chimeric exosomes-derived immunomodulator restoring lymph nodes microenvironment for sensitizing TNBC immunotherapy

Mengchi Sun et al. Nat Commun. .

Abstract

Immunotherapy is a breakthrough in the treatment of triple-negative breast cancer (TNBC), although it is only effective in a portion of patients. Our clinical studies find that pathological elevated level of reactive oxygen species (ROS) and lipid homeostasis imbalance are closely associated with dysfunction of dendritic cells (DCs) in the immunosuppressive lymph nodes (LNs) microenvironment of TNBC patients following immunotherapy, which greatly affect the immunotherapeutic efficacy. Building on this, we introduce a chimeric exosomes-derived immunomodulator involving the polysulfide bond-bridged mesoporous silica as both the ROS scavenger and responsive carrier nucleus, loading with the lipid modulator toyocamycin and being coated with chimeric exosomes comprising DCs-derived exosomes and Salmonella outer membrane vesicles. This multifaceted immunomodulator can significantly enhance LNs' homing through homologous targeting and chemokine-guided navigation, enabling ROS-responsive drug release, thereby restoring functions of DCs and LNs immuno-microenvironment. As expected, the immunomodulator significantly improves the responsiveness of TNBC to immunotherapy, exerting potent inhibition on both the primary tumor and metastases, while promoting a substantial increase in central memory T cells within LNs for sustained antitumor immunity. Our study provides a potent strategy for translational immunotherapy through optimizing the LNs microenvironment in TNBC.


Conflict of interest statement

Competing interests: The authors declare no competing interests.

Figures

Fig. 1
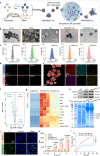
Fig. 1. Clinical data from TNBC patients.
a Illustrative representation of nLNs and mLNs from TNBC patients. b Kaplan-Meier plots of overall survival (OS) categorizing TNBC patients by LNs’ stage (Log-rank P value < 0.0001). N0 samples (n = 1536), N1 samples (n = 945), N2 samples (n = 190), N3 samples (n = 178). c MRI images depicting the primary tumor and mLNs in TNBC patients, with red arrows highlighting the affected areas. d Histopathological comparison between the nLNs and mLNs using H&E staining. e Immunohistochemistry (IHC) analysis of Foxp3 in the nLNs versus mLNs. f CLSM showcasing the co-localization of CD11c (red) with BODIPY (green) in the nLNs versus mLNs. g Multiplex IHC for immune profiling in the nLNs and mLNs from the TNBC patient (n = 4 independent experiments). Scale bar=100 μm. h Clustering analysis of immune cells in matched nLNs and mLNs’ samples from the TNBC patient. i Gene Ontology (GO) enrichment analysis of gene expression variations in DCs within the mLNs vs nLNs. P values are derived from one-sided Fisher’s Exact Test for pathway and GO enrichment. Source data are provided as a Source Data file.
Fig. 2
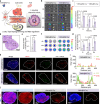
Fig. 2. Synthesis and ex vivo characterization of EMVs@SS-Toy.
a Stepwise schematic of EMVs@SS-Toy production. b TEM images of SS-Toy, OMVs, DEX, OMVs@SS-Toy and EMVs@SS-Toy. c Particle size distribution profiles for SS-Toy, OMVs, DEX, OMVs@SS-Toy and EMVs@SS-Toy. d CLSM showcasing the co-localization of SS-MSNFITC (green) with Dil (red) in OMVs@SS-Toy, and with APC-CD63 (red) in EMVs@SS-Toy. e Energy-dispersive X-ray spectroscopy (EDS) mapping displaying the composition of EMVs@SS-Toy with white arrow indicating the zoomed-in area, red represents carbon (C), blue represents oxygen (O), orange represents sulfur (S), purple represents silicon (Si), green represents nitrogen (N), and yellow represents phosphorus (P). f Differential protein expression in DCs following different treatments. The cutoff is defined by requiring the fold change (FC) to be greater than 1.5, with adjusted P < 0.05 (Benjamini-Hochberg-adjusted two-sided Welch’s t test). g Heatmaps representing gene expression involved in immune activation and antigen presentation in DCs following different treatments (n = 3 independent experiments). h Western blot probing for exosomal markers TSG101, CD9, and CD81 proteins. i SDS-PAGE analysis revealing the protein profiles of OMVs, OMVs@SS-Toy, DEX, and EMVs@SS-Toy. j CLSM images of cell uptake of SS-Toy and OMVs@SS-Toy in DCs, highlighting Nuclei (Hoechst 33342, blue) and SS-MSN (FITC, green). k Flow cytometric quantification of fluorescent uptake in DCs treated with Si-Toy, SS-Toy, OMVs@Si-Toy, and OMVs@SS-Toy over time (n = 3 independent experiments). **P  <  0.01, ***P  <  0.001 and ****P  < 0.0001 by two-tailed Student’s t-test. l Kinetics of Si-Toy and SS-Toy release in a 10 mM H2O2 environment at pH 7.4 (n = 3 independent experiments). **P  <  0.01 by two-tailed Student’s t-test. Data are presented as mean ± SD. *P < 0.05, **P < 0.01, ***P < 0.001 and ****P < 0.0001. Source data are provided as a Source Data file.
Fig. 3
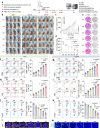
Fig. 3. Ex vivo evaluation of EMVs@SS-Toy on ROS scavenging, lipid production blockade, and immunostimulatory effects.
a CLSM image displaying ROS levels in TADCs 6 h post-treatment of PBS, Si-MSN, SS-Toy and EMVs@SS-Toy. b CLSM images displaying BODIPY levels in TADCs 6 h post-treatment of Toy and EMVs@SS-Toy. Nuclei stained with Hoechst 33342 (blue), ROS and lipids detected by DCFH-DA and BODIPY 493/503 probes (green), respectively. c The ROS level assessment in the TADCs by flow cytometry. d The BODIPY level assessment in the TADCs by flow cytometry. e. The differential gene expression between the samples treated with EMVs@SS-Toy and PBS. f Gene Ontology (GO) enriched pathways of the upregulated genes in the samples treated with EMVs@SS-Toy, showing immune-related terms. P values are derived from one-sided Fisher’s Exact Test for pathway and GO enrichment. g Gene set enrichment analysis (GSEA) of the term positive regulation of immune system process. P values for GSEA were calculated using two-sided permutation test, and adjusted using Benjamini-Hochberg methods. h Cytokine profiling in the TADCs culture using ELISA. i, j Flow cytometry analysis of CD80 and MHC I H-2 Kb expression in BMDCs (n = 3 independent experiments). *P < 0.05 and **P  <  0.01 by two-tailed Student’s t-test. k, l Flow cytometry analysis of CD8+ expression in CD3+ T cells (n = 3 independent experiments). *P < 0.05 and **P  <  0.01 by two-tailed Student’s t-test. Data are presented as mean ± SD. Source data are provided as a Source Data file.
Fig. 4
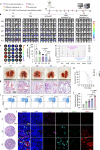
Fig. 4. In vivo homing and immunomodulatory effect of EMVs@SS-Toy.
a Illustrative representation of EMVs@SS-Toy’s lymph node-targeting in mice. b Ex vivo IVIS fluorescence images showing the biodistribution of fluorescence in the heart, liver, spleen, lungs, kidneys and tumor (n = 3 mice). c Quantitative analysis results of fluorescent intensity in tumor regions (n = 3 mice). d LNs histopathology with H&E staining. e Quantification of silicon uptake in LNs via ICP-MS at 24 h post-administration (n = 3 mice). f, g LNs-specific ex vivo IVIS fluorescence images and quantitative analysis of signal intensity (n = 3 mice). h CLSM images of LNs’ sections in LNs 24 h post i.v. administration of OMVs@SS-Toy and EMVs@SS-Toy, highlighting Nuclei (Hoechst 33342, blue), DCs (CD11c, red), and SSFITC-Toy (FITC, green) with co-localization (n = 3 independent experiments). i Quantitative results for co-localization in LNs’ sections post i.v. administration. j ROS detection in LNs 24 h post i.v. administration of PBS, OMVs@SS-Toy, and EMVs@SS-Toy (n = 3 independent experiments). Data are presented as mean ± SD. *P < 0.05 and **P < 0.01 by two-tailed Student’s t-test. Source data are provided as a Source Data file.
Fig. 5
Fig. 5. Antitumor effect in an orthotopic 4T1 breast cancer model.
a Schematic illustration of the assessment protocol evaluating antitumor efficiency. b Visual representation of tumor progression in treated mice, with tumors outlined by a yellow dashed line. c, d Comparison of tumor progression and weight post-treatment (n = 5 mice). e H&E and Ki67 immunohistochemistry in tumor sections, red arrows: regions of necrotic tumor cells, blue arrows: viable tumor cells. n = 5 mice. f, g Flow cytometry analysis of activated DCs (CD80+CD86+) in LNs and tumors (n = 5 independent experiments). h Flow cytometry analysis of CD3+CD8+ T cells in LNs (n = 5 independent experiments). i Flow cytometry analysis of CD8+ T cells within CD45+ cells from tumors (n = 5 independent experiments). j, k Flow cytometry analysis of Tregs (CD3+CD4+Foxp3+) in LNs and tumors (n = 5 independent experiments). CLSM imaging of (l) XBP1s and (m) BODIPY in LNs (n = 3 independent experiments). G1: PBS, G2: DOX, G3: DOX + SS-Toy, G4: DOX+OMVs@SS-Toy, G5: DOX+EMVs@SS-Toy, G6: DOX+aPD1+EMVs@SS-Toy. Data are presented as mean ± SD. *P < 0.05, **P < 0.01, ***P < 0.001 and ****P < 0.0001 by two-tailed Student’s t-test. Source data are provided as a Source Data file.
Fig. 6
Fig. 6. Antitumor effects in a metastatic breast cancer model.
a Schematic illustration of the administration strategy in a metastatic breast cancer model. b In vivo bioluminescence imaging of mice with 4T1-Luc metastatic tumors over time (n = 6 mice). c Ex vivo IVIS fluorescence imaging of excised lung tissues (n = 5 mice). d Quantification of fluorescence intensity in lung tissues (n = 5 mice). e Serum cytokines profiling for IL-6, IL-1β, IFN-γ, IL-12, TNF-α, and IL-10 post-treatment. f Representative images of lung morphology post-treatment. g H&E staining of lung sections for histophathological analysis. h Survival assessment after different treatment regimens (n = 9 mice). i Flow cytometry analysis of central memory T cells (CD3+CD8+CD62L+CD44+) in peripheral blood from treated groups (n = 5 independent experiments). j Quantitative analysis of central memory T cells (CD3+CD8+CD62L+CD44+) in peripheral blood from treated groups (n = 5 independent experiments). k H&E staining of hilar LNs after different treatments (n = 3 independent experiments). l Immunofluorescence characterization of CD8, CD11c, MHC I, and Foxp3 in hilar LNs (n = 3 independent experiments). G1: PBS, G2: DOX, G3: DOX+aPD1, G4: DOX+EMVs@SS-Toy, G5: DOX+aPD1+EMVs@SS-Toy. Data are presented as mean ± SD. **P < 0.01 and ****P < 0.0001 by two-tailed Student’s t-test. Source data are provided as a Source Data file.

References

    1. Leon-Ferre, R. A. & Goetz, M. P. Advances in systemic therapies for triple negative breast cancer. BMJ381, e071674 (2023). - PubMed
    1. Topalian, S. L. et al. Neoadjuvant immune checkpoint blockade: a window of opportunity to advance cancer immunotherapy. Cancer Cell41, 1551–1566 (2023). - PMC - PubMed
    1. Delclaux, I., Ventre, K. S., Jones, D. & Lund, A. W. The tumor-draining lymph node as a reservoir for systemic immune surveillance. Trends Cancer10, 28–37 (2024). - PMC - PubMed
    1. Rahim, M. K. et al. Dynamic CD8+ T cell responses to cancer immunotherapy in human regional lymph nodes are disrupted in metastatic lymph nodes. Cell186, 1127–1143.e1118 (2023). - PMC - PubMed
    1. du Bois, H., Heim, T. A. & Lund, A. W. Tumor-draining lymph nodes: at the crossroads of metastasis and immunity. Sci. Immunol.6, eabg3551 (2021). - PMC - PubMed

MeSH terms

Substances

LinkOut - more resources