. 2025 Aug 2;16(1):7099.
doi: 10.1038/s41467-025-61795-x.

Inhibition of epithelial cell YAP-TEAD/LOX signaling attenuates pulmonary fibrosis in preclinical models

Affiliations

Inhibition of epithelial cell YAP-TEAD/LOX signaling attenuates pulmonary fibrosis in preclinical models

Darcy Elizabeth Wagner et al. Nat Commun. .

Abstract

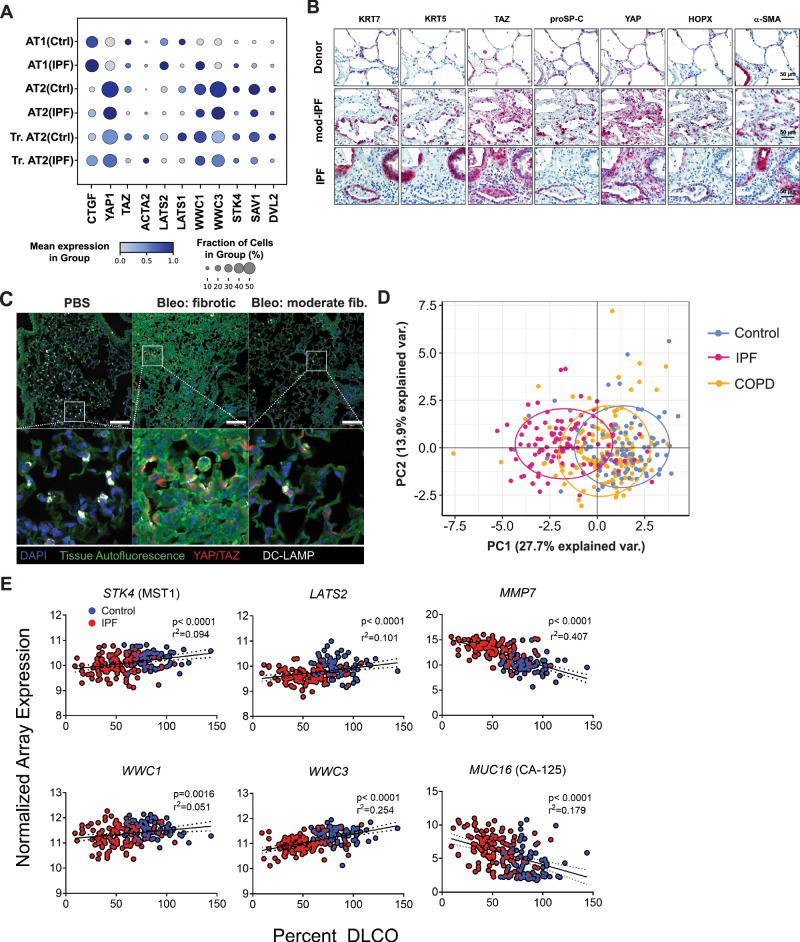
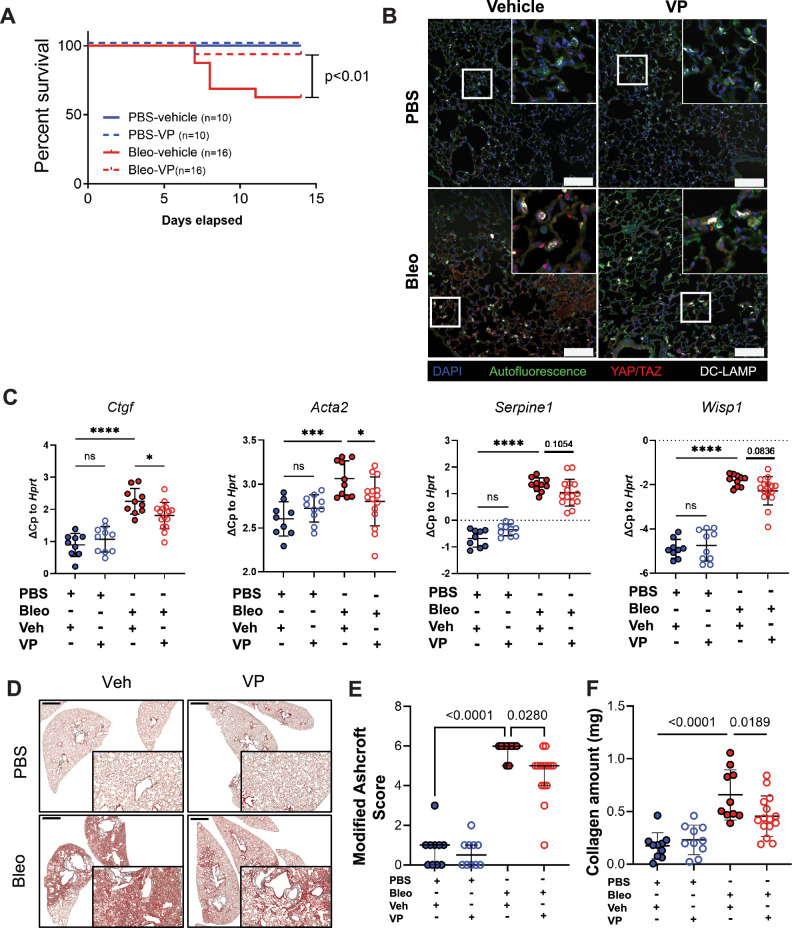
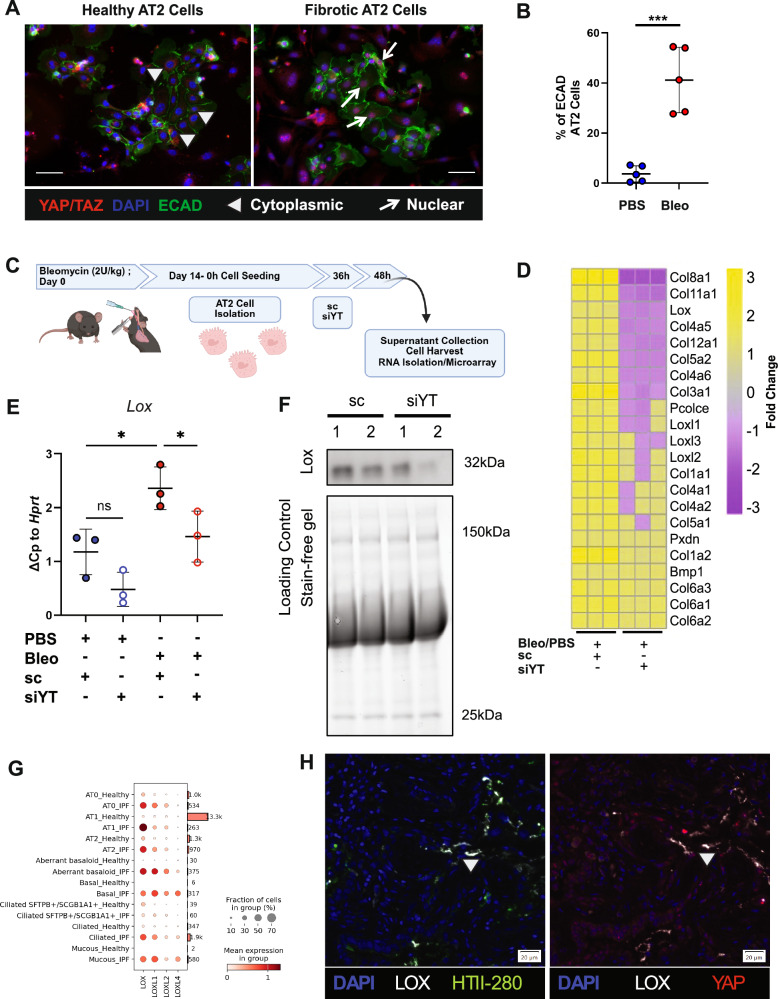
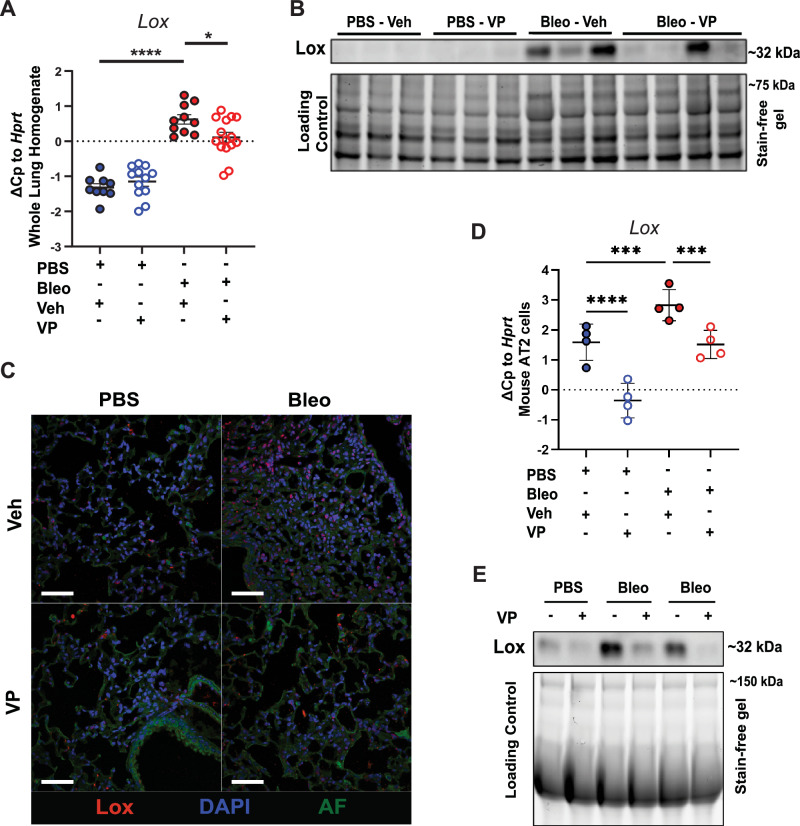
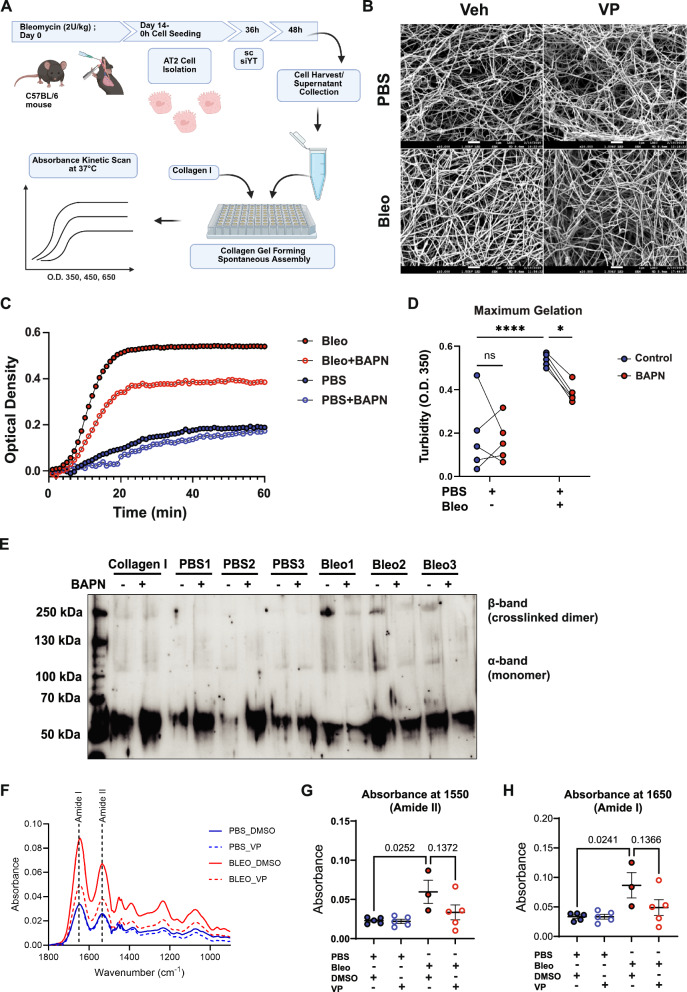
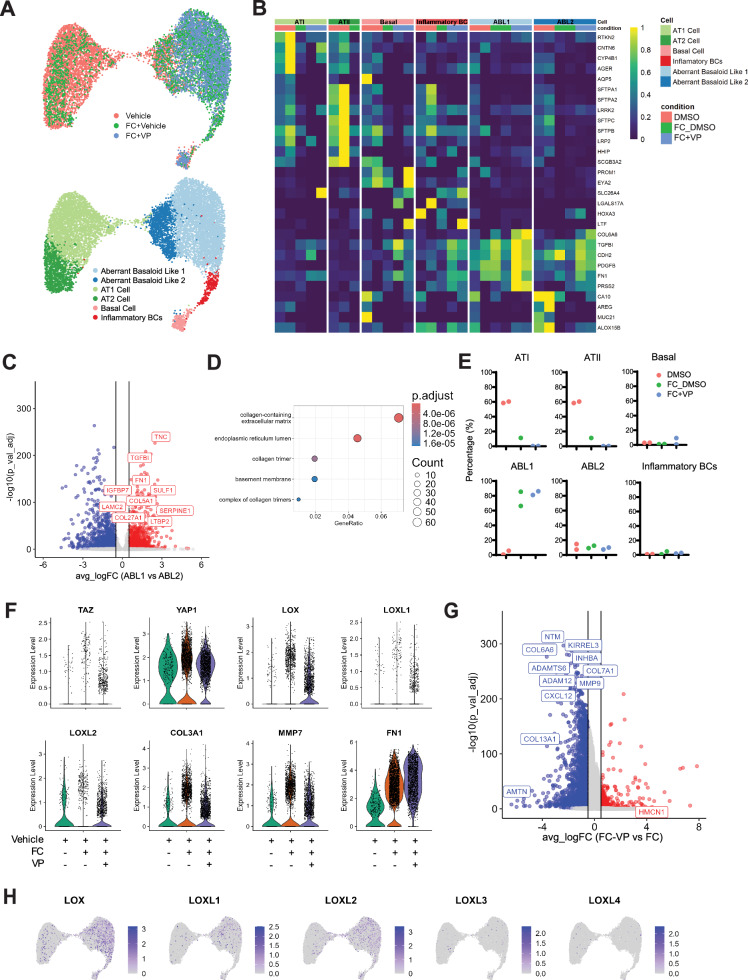
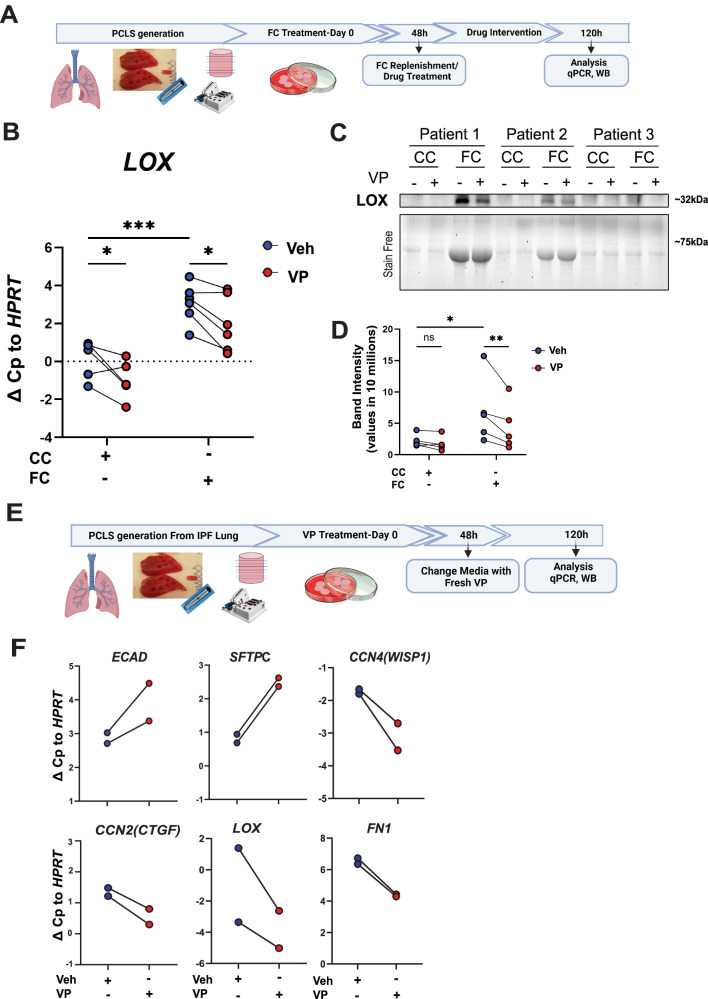
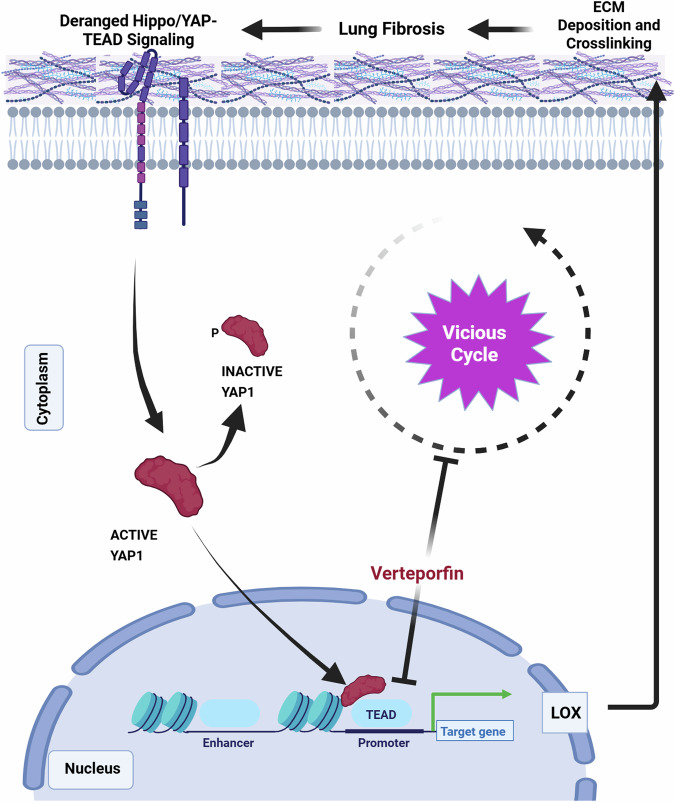
Idiopathic pulmonary fibrosis (IPF) is a progressive and lethal disease characterized by excessive extracellular matrix deposition. Current IPF therapies slow disease progression but do not stop or reverse it. The (myo)fibroblasts are thought to be the main cellular contributors to excessive extracellular matrix production in IPF. Here we show that fibrotic alveolar type II cells regulate production and crosslinking of extracellular matrix via the co-transcriptional activator YAP. YAP leads to increased expression of Lysl oxidase (LOX) and subsequent LOX-mediated crosslinking by fibrotic alveolar type II cells. Pharmacological YAP inhibition via verteporfin reverses fibrotic alveolar type II cell reprogramming and LOX expression in experimental lung fibrosis in vivo and in human fibrotic tissue ex vivo. We thus identify YAP-TEAD/LOX inhibition in alveolar type II cells as a promising potential therapy for IPF patients.


Conflict of interest statement

Competing interests: The authors declare no competing interests.

Figures

Fig. 1
Fig. 1. YAP/TAZ is upregulated and active in the aberrant epithelium in IPF.
A Publicly available scRNA-Seq data showing cell type specific gene expression in distal (alveolar) epithelial cells of IPF and Donor (Ctrl) lungs (IPFcellatlas.com: GSE135893). Changes in expression of Hippo family members, YAP, TAZ, and target gene CTGF in Donor versus IPF fibrotic epithelial cell subtypes is shown. (Tr. Transitional). B Representative Immunohistochemical staining of YAP, TAZ, epithelial, and mesenchymal markers on tissue sections for Donor tissue, moderate-fibrotic IPF, and full fibrotic IPF tissues. n = 6 donor, n = 6 moderate-fibrotic IPF, n = 13 full fibrotic IPF. C Representative immunofluorescence staining of Yap/Taz and Dc-Lamp, a marker of alveolar type II cells, on paraffin sections of murine lungs from PBS and bleomycin treated mice after 14 days. Scalebar 20 um on the top row. Bottom row is a digital zoom 5x. n = 5 PBS, n = 8 Bleomycin. D Principal component analysis (PCA) of microarray analysis on samples from control subjects (n = 91), IPF (n = 100), and COPD (n = 144) patients from the Lung Genome Research Consortium (LGRC) dataset using Hippo pathway genes found in Supplementary Table 1. E Pearson correlation coefficient (r2) between %DLCO measurements from Donor/IPF patients from the LGRC and gene expression of upstream Hippo signaling components STK4, LATS2, WWC1, WWC3 and the profibrotic markers MMP7 and MUC16. p < 0.05 considered significant; two-tailed. No adjustment made for multiple comparisons (k = 6 comparisons). Source data for Panels (A, D, and E) are provided as a Source Data file.
Fig. 2
Fig. 2. Pharmacological inhibition of YAP-TEAD improves survival and attenuates experimental lung fibrosis in vivo.
A Survival analysis during 14 days of mice treated with PBS and Bleomycin (2U/kg) with or without verteporfin (VP) injections administered intraperitoneally every 48 h starting from day 7 to day 14 (45 mg/kg). *p < 0.05 considered significant: log-rank (Mantel-Cox) test. B Representative immunofluorescence staining of Yap/Taz in tissue sections from normal and fibrotic mouse lungs injected with verteporfin (VP) in vivo, n = 10 in each PBS group and n = 16 in each Bleo group from two independent sets of experiments. Scalebar 100 μm (Inlay 3X). C Gene expression of Ctgf, Acta2, Serpine1, and Wisp1 relative to Hprt of tissue homogenates from study described in 2a. Each dot represents an individual mouse who survived until day 14 of the study. Mean ± s.d. *p < 0.05 assessed by one-way ANOVA with Holm-Šídák’s multiple comparisons test. Ctgf (PBS-veh vs. PBS-VP, p = 0.3422; Bleo-veh vs. Bleo-VP, p = 0.0134; PBS-veh vs. Bleo-veh, p = 0.0002); Acta2 (PBS-veh vs. PBS-VP, p = 0.2482; Bleo-veh vs. Bleo-VP, p = 0.0180; PBS-veh vs. Bleo-veh, p = <0.0001); Serpine1 (PBS-veh vs. PBS-VP, p = 0.1054; Bleo-veh vs. Bleo-VP, p = 0.1054; PBS-veh vs. Bleo-veh, p = <0.0001); Wisp1 (PBS-veh vs. PBS-VP, p = 0.5661; Bleo-veh vs. Bleo-VP, p = 0.0836; PBS-veh vs. Bleo-veh, p = <0.0001); D Representative Masson’s trichrome staining of paraffin sections of PBS and Bleomycin mouse lungs treated with VP, scale bar: 2 mm. All animals were stained thus n = 10 for both PBS groups and n = 10 for Bleomycin and n = 15 for Bleomycin-VP. E Modified Ashcroft Score of the histological staining of the mouse lungs described in (A), each dot represents the median score of 3 independent experts who performed blinded analysis on digitized histological slides containing multiple sections per animal. Thus, each dot represents the histological score per animal. Due to ordinal data, median with 95% confidence interval shown. *q < 0.05 considered significant and assessed by Kruskal–Wallis, corrected for multiple comparisons using the two-stage linear step-up procedure of Benjamini, Krieger and Yekutieli (q value). PBS-veh vs. PBS-VP (q = 0.2969), PBS-Veh vs. Bleo-Veh (q = <0.0001), Bleo-Veh vs. Bleo-VP (q = 0.028). F Collagen amount as measured by high performance liquid chromatography of total tissue homogenates of mouse lungs described in (A); Each dot represents an individual mouse who survived until day 14 of the study. Mean ± s.d. *p < 0.05 assessed by one-way ANOVA with Holm-Šídák’s multiple comparisons test. PBS-veh vs. PBS-VP (p = 0.4841), PBS-Veh vs. Bleo-Veh (p = <0.0001), Bleo-Veh vs. Bleo-VP (p = 0.0189) Source data for Panels (A, C, E and F) are provided as a Source Data file. Source Data for Panel (D) is deposited at S-BIAD1520.
Fig. 3
Fig. 3. YAP/TAZ in fibrotic AT2 cells regulate LOX secretion and collagen crosslinking.
A Representative immunofluorescence images (20× objective) of YAP/TAZ and E-cadherin in primary murine (pm) AT2 cells isolated from fibrotic and control murine lungs and plated on glass cover slips (200,000/cm2) (n = 5 each group). Scale bar = 50 μm. B Quantification of YAP/TAZ positive cells in healthy and fibrotic AT2 cells in (A). Quantification by image J of 5 independent pmAT2 isolates each, 5 fields per sample. Y-Axis depicts percent of ECAD positive AT2 cells with nuclear YAP/TAZ staining, Mean ± s.d. ***p < 0.0001 unpaired, two-tailed t-test. p = 0.0003. C Schematic of experiments to silence Yap/Taz using siRNA (siYT) and the corresponding analyses. Created in BioRender. Wagner, D. (2025) https://BioRender.com/nmwzx11. D Heatmap of matrix genes from microarray data of pmAT2 cells isolated from bleomycin treated mice vs PBS treated mice followed by siRNA-mediated silencing of Yap/Taz (siYT), n = 3. Left 3 columns show fold change expression in fibrotic AT2 cells normalized with fold change expression in healthy AT2 cells. Right 3 columns show fold change expression in fibrotic AT2 cells subjected to siYT normalized with scramble control (sc). E Gene expression of lysl oxidase (Lox) in pmAT2 cells isolated from normal and fibrotic mice and culture with siYT, n = 3 independent isolations. Mean ± s.d. *p < 0.05 paired one-way ANOVA with repeated measures and pre-selected comparisons. Corrected for multiple comparisons using Šídák’s multiple comparisons test. PBS-sc vs. PBS-siYT (p = 0.1002); PBS-sc vs Bleo-sc (p = 0.0106); Bleo-sc vs. Bleo-siYT (0.0373). F Immunoblotting of Lox in the supernatants of study described in (C). G LOX-family members are elevated in epithelial cells in IPF tissue sections, with LOX prominently elevated in comparison to other LOX-family members (data extracted from ref. ). H YAP, LOX staining with HTII-280 (a marker of AT2 cells) in human lung sections of control and IPF tissue showing localization of LOX in areas of aberrant alveolar remodeling. Source data for Panels (B, E and F) are provided as a Source Data file. Source Data for Panel (D) is deposited E-MTAB-14643 and (H) is deposited at S-BIAD1520.
Fig. 4
Fig. 4. YAP/TEAD inhibition by verteporfin reduces Lox expression and ECM crosslinking in fibrotic AT2 cells.
Lox gene expression (n = 10 each) (*adjusted p < 0.05 considered significant with one-way ANOVA with Holm-Šídák’s multiple comparisons test). Mean ± s.d. PBS-veh vs. PBS-VP (p = 0.5039), p < 0.0001 for PBS-veh vs Bleo-veh, Bleo-veh vs. Bleo-VP (p = 0.400). B Immunoblotting of Lox protein on tissue homogenates of normal and fibrotic mouse lungs injected with VP in vivo, n = 3–4 as shown. C Representative immunofluorescence staining of Lox in tissue sections obtained from the same study described in (A) and (B) (Supplementary Fig. S2), scale bar: 50 um. (AF Autofluorescence). DLox gene expression. Mean ± s.d. *adjusted p < 0.05 considered significant with one-way ANOVA with repeated measures and pre-selected comparisons. Corrected for multiple comparisons using Holm-Šídák’s multiple comparisons test. PBS-veh vs. PBS-VP (p < 0.0001); PBS-veh vs Bleo-veh (p = 0.00009); Bleo-veh vs. Bleo-VP (0.0006). n = 4 independent isolations and E immunoblotting of Lox protein in supernatants of pmAT2 cells isolated from normal and fibrotic mice and treated with VP for 48 h, representative image, n = 4. Equal protein was loaded into each well and confirmed through the use of stain-free gels which label tryptophans. Source data for Panels (A, B, D and E) are provided as a Source Data file.
Fig. 5
Fig. 5. AT2 cell derived LOX mediates collagen gelation.
A Schematics for collagen assembly assay with supernatants from pmAT2 cells isolated from normal and fibrotic mouse lungs were treated with siYT. Rat-tail type I collagen was used in a carbonate buffer at 1 mg/ml, pH 7.8, and 37 °C with the addition of biological sample, and turbidity is monitored with optical density measurement for the first two hours. Immunoblotting of collagen I and scanning electron microscopy (SEM) of the resulting gels were used as endpoint measurements, n = 3. Created in BioRender. Wagner, D. (2025) https://BioRender.com/nmwzx11. B SEM images of collagen formation assay described in Fig. 5A and performed on supernatants from pmAT2 cells isolated from normal and fibrotic mice and treated with VP for 48 h, n = 4 animals. scale bar: 1 um (×10,000). C Collagen gelation kinetic curves using BALF treated ex vivo with beta-aminopropionitrile (BAPN) from animals treated for 14 days with PBS or Bleomycin. Each line represents the average of n = 5 animals per condition. OD350nm. D Maximum gelation of curves in (C); Two-way ANOVA with uncorrected Fisher’s LSD. PBS (Control vs. BAPN, p = 0.7197), Bleomycin (Control vs. BAPN, p = 0.0162), Control (PBS vs. Bleomycin, p < 0.0001); E Immunoblotting of collagen I of gels from (D) after gelation for 48 h at 37 °C. FH FTIR spectra and peak quantification from lung tissue sections of one cohort from PBS or Bleomycin-treated animals who received VP or DMSO controls. N = 5 for PBS, n = 3 for BLEO-DMSO and n = 5 for BLEO-VP; F mean of all samples shown without error bars. G, H Mean ± s.d. p-values indicated for one-way ANOVA with Tukey posthoc test. p < 0.05 considered significant. Source data for Panels (CH) are provided as a Source Data file. Source Data for Panel (B) is deposited at S-BIAD1520.
Fig. 6
Fig. 6. YAP-TEAD inhibition by verteporfin reduces profibrotic genes in human fibrotic lung tissue ex vivo.
A Uniform Manifold Approximation and Projection (UMAP) representation of 11753 epithelial nuclei from 24 PCLS generated from 2 control donor lungs (4 PCLS per subject and per condition); the UMAPs are labeled by condition (4 PCLS per subject and per condition): Vehicle (Veh), Fibrotic Cocktail (FC)+Veh, FC+Verteporfin (VP), (top panel) or by cell type, Aberrant Basaloid Like 1 and 2; alveolar type 1 (AT1) cell; alveolar type 2 (AT2) cell, Basal cell; and Inflammatory Basal Cells (BCs)(bottom panel). B Heat map of normalized gene expression per cell type within each condition; Columns are ordered by disease status and cell type. C Differential gene expression between the two aberrant basaloid nuclei clusters, genes labeled in red are upregulated in aberrant basaloid like 1 cluster (log2FoldChange > 0.5; adjusted p-value < 0.05, Bonferroni correction in FindMarkers()); labeled genes are selected based on GO enrichment in (D). D Gene Ontology enrichment based on the upregulated genes in aberrant basaloid Like 1 cells in comparison to aberrant basaloid like 2 cells; the top 4 terms in the cell compartments (CC) terms are displayed. E Percent makeup distributions of each identified cell type across all sampled epithelial cells per subject within each condition. Each dot represents a single subject. Adj.p-value calculated in REACTOME with Benjamini–Hochberg. F Violin plots of expression of aberrant basaloid cell markers and Lysyl oxidase (LOX) family genes. G Differential gene expression of PCLS treated with fibrotic cocktail and verteporfin compared with fibrotic cocktail alone in the aberrant basaloid like 1 cluster (adjusted p-value  <  0.05, Bonferroni correction in FindMarkers()), negative fold change > −0.5 (blue) ie Downregulated, and positive fold change >0.5 (red) ie Upregulated. H Feature-plots of LOX genes showing gene expression across all nuclei in all samples. Source data for Fig. 6 are provided at 10.5281/zenodo.14229565.
Fig. 7
Fig. 7. YAP-TEAD inhibition by verteporfin reduces LOX and fibrotic markers in human fibrotic lung tissue ex vivo.
A Schematics for precision-cut lung slice (PCLS) generation from donor lung and treatment with the fibrosis cocktail (FC) and verteporfin (VP) ex vivo for 5 days. B LOX gene expression of in PCLS treated with the fibrosis cocktail and VP, n = 5 patients for CC and n = 6 for FC conditions; Two-way ANOVA with uncorrected Fisher’s LSD. CC (Veh (DMSO) vs. VP, *p = 0.0199), FC (Veh vs. VP, *p = 0.0176), Veh (CC vs. FC, ***p = 0.0005). C, D Immunoblotting and quantification of LOX in supernatants obtained from PCLS in study described in Fig. 7A; (*p < 0.05, paired t-test and ns unpaired t-test). Stain-Free technology is shown for qualitative evaluation only as an estimation of total protein in supernatants; it is not used for quantification in (D) as it labels tryptophan amino acids which are not present in collagen and thus underestimates total protein amounts in supernatants (see Supplementary Fig. S17 legend for further details). Quantification in (D) was performed on the LOX detected in the separate blots, run in parallel, shown in Panel (C) and Supplementary Fig. S17. PCLS derived from individual patients were run on the same blots to permit relative comparisons for the patient’s own control conditions. *p < 0.05 as assessed by Two-way ANOVA with uncorrected Fisher’s LSD. CC (DMSO vs. VP, p = 0.4421), FC (DMSO vs. VP, p = 0.0022), DMSO (CC vs. FC, p = 0.0399); n = 5 patients. E Schematics for experiments using PCLS derived from IPF tissue explants and treated with VP. F Gene expression of CDH1 (ECAD), SFTPC, CCN4 (WISP1), CCN2 (CTGF), LOX, and FN1 in IPF PCLS treated with VP, n = 2. Panels (A and E) Created in BioRender. Wagner, D. (2025) https://BioRender.com/nmwzx11. Source data for Panels (BD, F) are provided as a Source Data file.
Fig. 8
Fig. 8. Summary of proposed vicious Hippo-YAP/LOX mediated extracellular matrix (ECM) remodeling cycle driven by lung epithelial cells in IPF.
Derangement of the Hippo signaling pathway components lead to the activation of YAP-TEAD activity in the nucleus leading to increased gene expression of matrix molecules and modifying enzymes (such as LOX) leading to increased secretion of LOX from the fibrotic alveolar epithelial cells, which contributes to increased crosslinking of secreted matrix in the ECM. This increase in matrix crosslinking causes further changes in the mechanical stiffness that leads to further increase in YAP activity. Created in BioRender. Wagner, D. (2025) https://BioRender.com/nmwzx11.

Similar articles

References

    1. Wolters, P. J., Collard, H. R. & Jones, K. D. Pathogenesis of idiopathic pulmonary fibrosis. Annu. Rev. Pathol.9, 157–179 (2014). - PMC - PubMed
    1. Wolters, P. J. et al. Time for a change: is idiopathic pulmonary fibrosis still idiopathic and only fibrotic?. Lancet Respir. Med.6, 154–160 (2018). - PMC - PubMed
    1. Martinez, F. J. et al. Idiopathic pulmonary fibrosis. Nat. Rev. Dis. Prim.3, 17074 (2017). - PubMed
    1. Martinez, F. J. & Lederer, D. J. Focus on idiopathic pulmonary fibrosis: advancing approaches to diagnosis, prognosis, and treatment. Chest154, 978–979 (2018). - PubMed
    1. Noth, I. & Martinez, F. J. Recent advances in idiopathic pulmonary fibrosis. Chest132, 637–650 (2007). - PubMed

MeSH terms

LinkOut - more resources