. 2025 Aug 2;8(1):500.
doi: 10.1038/s41746-025-01892-9.

AI enhanced diagnostic accuracy and workload reduction in hepatocellular carcinoma screening

Affiliations

AI enhanced diagnostic accuracy and workload reduction in hepatocellular carcinoma screening

Rui-Fang Lu et al. NPJ Digit Med. .

Abstract

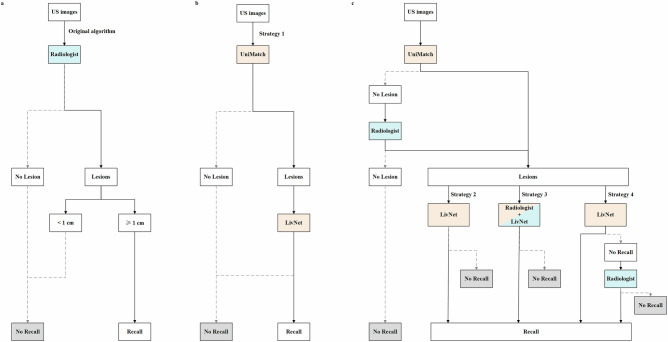
Hepatocellular carcinoma (HCC) ultrasound screening encounters challenges related to accuracy and the workload of radiologists. This retrospective, multicenter study assessed four artificial intelligence (AI) enhanced strategies using 21,934 liver ultrasound images from 11,960 patients to improve HCC ultrasound screening accuracy and reduce radiologist workload. UniMatch was used for lesion detection and LivNet for classification, trained on 17,913 images. Among the strategies tested, Strategy 4, which combined AI for initial detection and radiologist evaluation of negative cases in both detection and classification phases, outperformed others. It not only matched the high sensitivity of original algorithm (0.956 vs. 0.991) but also improved specificity (0.787 vs. 0.698), reduced radiologist workload by 54.5%, and decreased both recall and false positive rates. This approach demonstrates a successful model of human-AI collaboration, not only enhancing clinical outcomes but also mitigating unnecessary patient anxiety and system burden by minimizing recalls and false positives.


Conflict of interest statement

Competing interests: The authors declare no competing interests.

Figures

Fig. 1
Fig. 1. Flowchart of the original algorithm and the four human-artificial intelligence (AI) interaction strategies.
Blue boxes indicate instances where the radiologist is engaged in the work. Orange boxes indicate instances where AI completely replaces the radiologist. A box that is half blue and half orange indicates instances where AI assists the radiologist, allowing them to autonomously decide whether to adopt or disregard AI suggestions. Gray boxes indicate endpoints that require no recall. a The original algorithm: radiologists performed lesion detection and classification on images, deciding whether to recall or no recall. b Strategy 1 (Stand-Alone AI): UniMatch was used in lesion detection and LivNet was used in lesion classification to determine whether to recall or not. c Strategies 2, 3, and 4 are identical in the lesion detection. UniMatch was employed to detect lesions. If no lesion was detected, the image would be further evaluated by radiologists. After that, images without a lesion require no recall. Images with lesions detected either by radiologists or UniMatch are then classified using different methods according to the various strategies. In Strategy 2 (AI as a triage tool with radiologist read negative cases in lesion detection), images with detected lesions were classified by LivNet. Benign lesions did not require recall, whereas malignancy did. In Strategy 3 (AI as a triage tool and radiologist’s aid), images with detected lesions were classified by radiologists assisted by LivNet. In Strategy 4 (AI as a triage tool with radiologist read negative cases in lesion detection and classification), images with detected lesions were classified by LivNet. Lesions assigned as malignant required recall, while those assigned as benign were further evaluated by radiologists to determine the necessity of recall was, aiming to ensure a high sensitivity of classification.
Fig. 2
Fig. 2. Data collection process for model training and testing in human-AI interaction strategies.
Flowchart illustrates the data collection process for the model training and test for human-AI interaction strategies. The study initially involved 13,227 patients at risk of hepatocellular carcinoma who underwent ultrasound screening. After 1267 patients were excluded, the final patients were divided into a training set of 9891 and a test set of 2069.
Fig. 3
Fig. 3. Performance of original algorithm and four Human-AI interaction strategies in test set.
The Receiver Operating Characteristic (ROC) curves compared the performance of different AI-enhanced strategies for hepatocellular carcinoma ultrasound screening. The black line represents the ROC curve for LivNet, used as a baseline for comparison. Each symbol on the graph represents a different strategy: the square (blue) for the original algorithm, the triangle (green) for Strategy 1, the star (red) for Strategy 2, the diamond (orange) for Strategy 3, and the circle (purple) for Strategy 4. The area under the curve (AUC) for each strategy demonstrated the varying levels of diagnostic accuracy: LivNet (AUC = 0.837), Original algorithm (AUC = 0.845), Strategy 1 (AUC = 0.860), Strategy 2 (AUC = 0.865), Strategy 3 (AUC = 0.892), and Strategy 4 (AUC = 0.872).
Fig. 4
Fig. 4. Entropy of incorrect judgments across four strategies in test set.
The violin plot depicts the distribution of entropy for incorrect judgments across four strategies on the test set. The width of the violin plot at each point corresponds to the density of the data at that value. Boxes represent the 25th–75th percentiles, the whiskers indicate the minimum and maximum values, and the solid black squares represent the medians.
Fig. 5
Fig. 5. Network architecture of de-markers model.
De-markers model illustrates a two-stage generative algorithm that combines a segmentation model (DeepLabv3 + ) and a Transformer-based inpainting model (MAT) to effectively remove measurement markers from ultrasound images. MAT Mask-Aware Transformer.
Fig. 6
Fig. 6. Network architecture of UniMatch.
a The network architecture of labeled images. b The network architecture of unlabeled images. X = original images, Y = ground-truth mask of X, P = prediction of X, Xw = original image with weak perturbation, Xs1 and Xs2 = original images with strong perturbation, Pw = prediction of Xw, Pfp = prediction of Xw with channel-wise dropout operation, Ps1 and Ps2= predictions of Xs1 and Xs2. AASP atrous spatial pyramid pooling.
Fig. 7
Fig. 7. Network architecture of LivNet.
a The blue dashed box represents the multi-scale expert module, the yellow dashed box represents the local expert module, the red dashed box represents the global expert module, and the green dashed box represents the ordinary expert module. The text below each dashed box indicates which expert it represents. b The network architecture of deformable convolution block. c The network architecture of cross-self attention block. FPN feature pyramid network. FFN feed-forward network. LN layer normalization.

References

    1. Bray, F. et al. Global cancer statistics 2022: GLOBOCAN estimates of incidence and mortality worldwide for 36 cancers in 185 countries. CA: Cancer J. Clin.10.3322/caac.21834 (2024). - PubMed
    1. EASL Clinical Practice Guidelines: Management of hepatocellular carcinoma. J. Hepatol.69, 182–236, (2018). - PubMed
    1. Marrero, J. A. et al. Diagnosis, Staging, and Management of Hepatocellular Carcinoma: 2018 Practice Guidance by the American Association for the Study of Liver Diseases. Hepatol. (Baltim., Md.)68, 723–750 (2018). - PubMed
    1. Singal, A. G. et al. AASLD Practice Guidance on prevention, diagnosis, and treatment of hepatocellular carcinoma. Hepatol. (Baltim., Md.)78, 1922–1965 (2023). - PMC - PubMed
    1. Vosshenrich, J. et al. Quantifying Radiology Resident Fatigue: Analysis of Preliminary Reports. Radiology298, 632–639 (2021). - PubMed

LinkOut - more resources