. 2025 Aug 2;16(1):7106.
doi: 10.1038/s41467-025-62530-2.

B cell maturation antigen (BCMA) is dispensable for the survival of long-lived plasma cells

Affiliations

B cell maturation antigen (BCMA) is dispensable for the survival of long-lived plasma cells

Shannon R Menzel et al. Nat Commun. .

Abstract

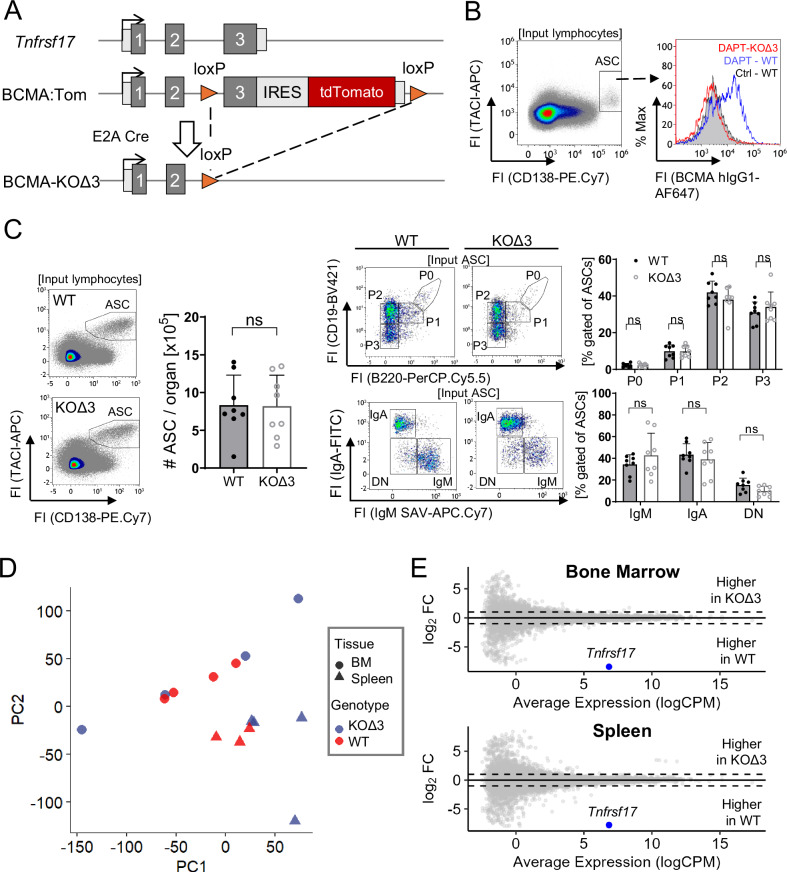
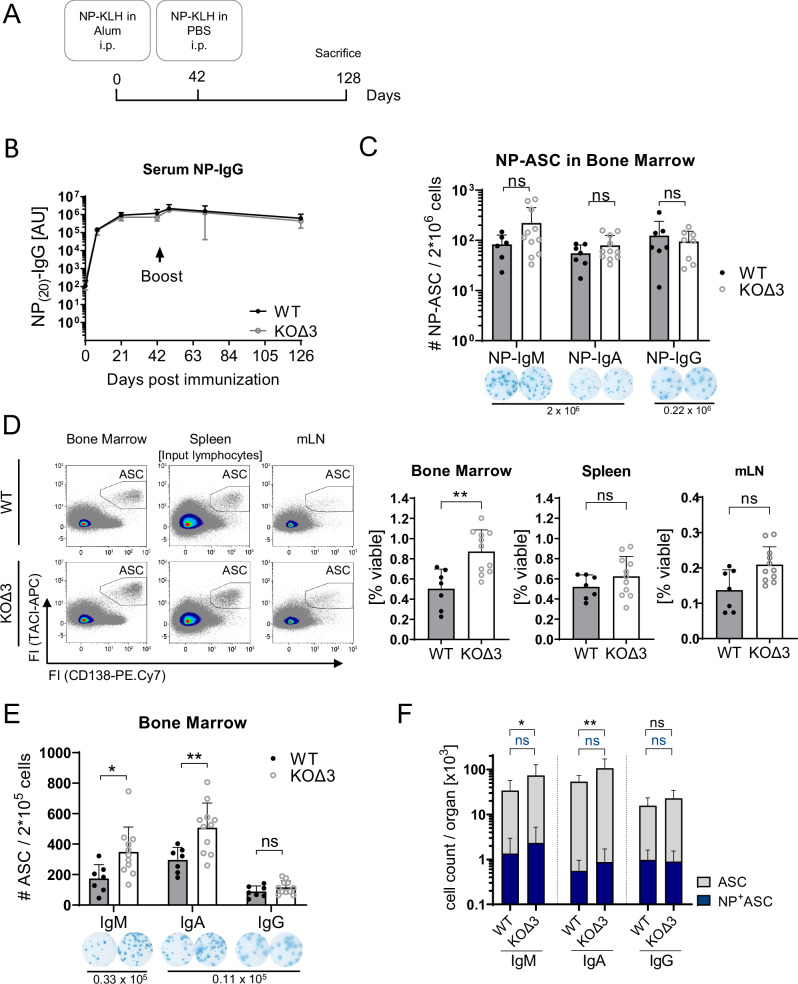
The survival of antibody-secreting plasma cells is essential for long-lasting humoral immunity. BCMA is proposed to promote APRIL-mediated survival signals. However, extensive shedding of murine BCMA raises doubts about its role as a signaling receptor. To unequivocally establish BCMA's function in plasma cell survival, we generate two BCMA-deficient mouse lines and examine antigen-specific plasma cells post-immunization. Contrary to previous reports, both BCMA-deficient mouse lines have comparable numbers of antigen-specific long-lived plasma cells following both protein and mRNA immunizations. Transcriptome analysis reveals no reduction in survival signaling upon BCMA deletion. Interestingly, BCMA-deficient mice show increased total plasma cell numbers in the bone marrow and mesenteric lymph nodes after boost immunizations. These results indicate that BCMA has no intrinsic role in maintaining long-lived plasma cells. Instead, we propose that BCMA's function is limited to acting as a soluble decoy receptor for APRIL, thereby fine-tuning the plasma cell population size by limiting survival factor availability. Our findings thus provide a strong argument against the APRIL-BCMA axis being a central mechanism for plasma cell longevity.


Conflict of interest statement

Competing interests: The authors declare no competing interests.

Figures

Fig. 1
Fig. 1. Characterization of antibody-secreting cell subsets in BCMA-KOΔ3 mice.
A Schematic illustration of the genetic locus of BCMA-KOΔ3 mice. BCMA:Tom mice with loxP sites flanking exon 3 of the BCMA-encoding Tnfrsf17 gene and the IRES-tdTomato cassette were crossed to E2A-Cre mice, resulting in a germline deletion of exon 3. Exons are illustrated in gray boxes, and light gray boxes indicate 5’ and 3’ UTRs. B Flow cytometric analysis of BCMA cell surface abundance on splenic ASCs after y-secretase inhibitor (DAPT) treatment using the anti-BCMA antibody clone 25C2. Splenic single-cell suspensions were cultured for 18 h with 1 µM DAPT or DMSO solvent control (Ctrl). C Representative gating strategy to quantify frequencies of CD138+TACI+ ASCs, ASC subsets P0 (B220hiCD19hi), P1 (B220+CD19+), P2 (B220CD19+), and P3 (B220CD19) and IgH-chain isotype distribution in the bone marrow (BM) ASCs. Double negative (DN) ASCs contain mostly IgG ASCs,. n = 8 mice per group from 3 independent experiments. Bar diagrams show mean and SD with each dot indicating one mouse. D, E Transcriptome analysis of bone marrow and splenic ASCs isolated from non-immunized BCMA-KOΔ3 and wildtype mice (WT). Principal component analysis (D) visualizes sample similarities; differential gene expression is visualized in the MA plot (E). In BCMA-KOΔ3 ASCs, no upregulated genes were detected, and the only downregulated gene (Tnfrsf17) is colored in blue. Statistical analysis in (C) was performed with a two-tailed unpaired t-test to compare total ASC numbers. Comparisons of ASC subsets were conducted by two-way ANOVA with Šídák’s correction for multiple comparisons. Exact p-values, mouse sex, and ages are provided in the Source Data file. ns not significant, ASC antibody-secreting cell, PC principal component.
Fig. 2
Fig. 2. Quantification of antigen-specific and total ASCs in BCMA-KOΔ3 and WT mice after T-dependent immunization with NP-KLH.
A Schematic illustration of the experimental setup. BCMA-KOΔ3 and WT control mice were immunized with 100 µg NP-KLH in alum and analyzed 7 weeks after immunization. B NP-specific IgG serum concentration was determined by ELISA for WT (black, n = 9) and BCMA-KOΔ3 mice (gray, n = 6). C IgH-chain isotype-specific quantification of antigen-specific ASCs by ELISpot analysis in bone marrow. The images below are representative pictures of ELISpot analysis with numbers indicating the number of cells seeded per well (NP-IgM: n = 7 (WT), 5 (KOΔ3); NP-IgA: n = 9 (WT), 6 (KOΔ3); NP-IgG: n = 8 (WT), 6 (KOΔ3)). D Flow cytometric quantification of total ASC numbers per organ (Bone marrow was pooled from one femur and tibia/mouse, n = 9 WT and 10 KOΔ3 for bone marrow and splenic ASCs; n = 8 WT and 10 KOΔ3 for mLN ASCs). E Flow cytometric quantification of germinal center (GC) B cells and antigen-specific GC B cells (NP+ GC B cells) numbers in the spleen. Bar diagrams show mean and SD with each dot indicating one mouse (GC B cell: n = 6 WT mice and n = 7 BCMA-KOΔ3 mice, NP+ GC B cell: n = 5 WT mice and n = 4 BCMA-KOΔ3 mice). All statistical comparisons were performed using a two-way ANOVA with Šídák’s multiple comparisons test. Exact p-values, mouse sex, and ages are provided in the Source Data file. ns not significant, ASC antibody-secreting cell, i.p. intra-peritoneal, mLN mesenteric lymph node, BC B cell.
Fig. 3
Fig. 3. Quantification of antigen-specific and total ASCs in BCMA-KOΔ3 and WT mice after secondary T-dependent immunization with NP-KLH.
A Schematic illustration of the experimental setup. BCMA-KOΔ3 and control mice were immunized with 100 µg NP-KLH in alum, boosted with 50 µg NP-KLH in PBS on day 42, and analyzed on day 128. B NP-specific IgG serum concentrations were determined by ELISA for wildtype (WT) (black, n = 7) and BCMA-KOΔ3 mice (gray, n = 8). C IgH-chain isotype-specific quantification of antigen (NP)-specific ASCs by ELISpot analysis in bone marrow. The images below are representative pictures of ELISpot analysis with numbers indicating the number of cells seeded per well (n = 6 WT and 11 KOΔ3 for NP-IgM; n = 7 WT and 11 KOΔ3 for NP-IgA; n = 7 WT and 8 KOΔ3 for NP-IgG). D Flow cytometric quantification of total ASC numbers per organ (bone marrow was pooled from one femur and one tibia/mouse, n = 7 WT and 11 KOΔ3). E IgH-chain isotype-specific quantification of total bone marrow ASCs by ELISpot analysis. The numbers below the ELISpot images indicate the number of seeded cells per well (n = 7 WT and 11 KOΔ3). F Stacked bar diagram with combined data from C and E. Bar diagrams show mean and SD with each dot indicating one mouse. Statistical analysis in B and F was performed using a two-way ANOVA with Šídák’s multiple comparisons test. Statistical analysis (CE) was performed with unpaired t-tests, correcting for multiple comparisons by the false discovery rate (FDR) according to Benjamini, Krieger, and Yekutieli's Two-stage step-up Method. Exact p-values, mouse sex, and ages are provided in the Source Data file. ASC antibody-secreting cell, WT wildtype, ns not significant, i.p. Intra-peritoneal, mLN mesenteric lymph node, *p ≤ 0.05, **p ≤ 0.01.
Fig. 4
Fig. 4. Flow cytometric analysis of antigen-specific ASCs and ASC subsets in BCMA-KOΔ3 mice upon prime/boost immunization with the mRNA vaccine mRNA-1273.
A Schematic illustration of the experimental setup. Mice were intramuscularly immunized and boosted on day 42 with 5 µg mRNA-1273 each and analyzed on day 126. B RBD-specific IgG serum concentrations were determined by ELISA for wildtype (WT, black, n = 7) and BCMA-KOΔ3 mice (KOΔ3, gray, n = 9). Flow cytometric quantification of (C) RBD-specific CD138+TACI+ ASCs in the bone marrow (n = 7 WT and 8 KOΔ3) and (D) total ASC numbers in bone marrow, spleen, and mLN (n = 7 WT and 9 KOΔ3). E IgH isotype-specific total and RBD-specific ASC counts in the bone marrow were determined by flow cytometry and visualized in a stacked bar diagram. F Concentration of total serum IgM, IgG, and IgA and feces IgA in BCMA-KOΔ3 and wildtype mice at day 126 (n = 8 WT and 9 KOΔ3). Bar diagrams show mean and SD with each dot indicating one mouse. Statistical analysis in B and E was performed using a two-way ANOVA with Šídák’s multiple comparisons test. Statistical analysis (C, D, F) was performed with unpaired t-tests. Exact p-values, mouse sex, and ages are provided in the Source Data file. G, H Transcriptome analysis of bone marrow ASCs isolated of mRNA-1273 immunized BCMA-KOΔ3 and wildtype mice (WT) on day 126 after primary immunization. Principal component analysis visualizes sample similarities (G), and differential gene expression is documented in the MA plot (H). In BCMA-KOΔ3 ASCs, no upregulated genes were detected; the only downregulated gene (Tnfrsf17) is colored in blue. ASC antibody-secreting cells, RBD receptor binding domain of the SARS-CoV-2, i.m. intramuscular, ns not significant, mLN mesenteric lymph node, *p ≤ 0.05, **p ≤ 0.01, ****p ≤ 0.0001.

References

    1. Manz, R. A., Thiel, A. & Radbruch, A. Lifetime of plasma cells in the bone marrow. Nature388, 133–134 (1997). - PubMed
    1. Slifka, M. K., Antia, R., Whitmire, J. K. & Ahmed, R. Humoral immunity due to long-lived plasma cells. Immunity8, 363–372 (1998). - PubMed
    1. Robinson, M. J. et al. Intrinsically determined turnover underlies broad heterogeneity in plasma-cell lifespan. Immunity56, 1596–1612.e4 (2023). - PubMed
    1. Landsverk, O. J. B. et al. Antibody-secreting plasma cells persist for decades in human intestine. J. Exp. Med.214, 309–317 (2017). - PMC - PubMed
    1. Bossen, C. & Schneider, P. BAFF, APRIL and their receptors: structure, function and signaling. Semin. Immunol.18, 263–275 (2006). - PubMed

MeSH terms

Substances

LinkOut - more resources