
Classification of GBA1 variants and their impact on Parkinson's disease: an in silico score analysis

Aymeric Lanore et al. NPJ Parkinsons Dis. .

Abstract

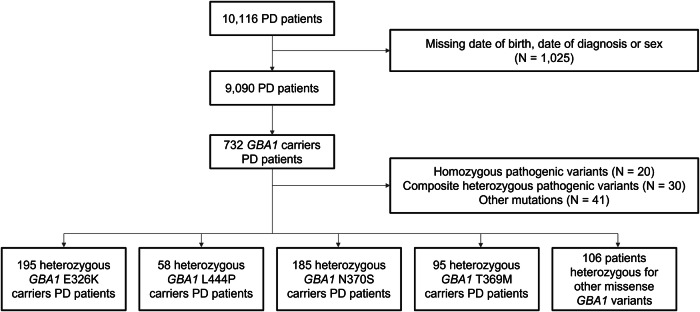
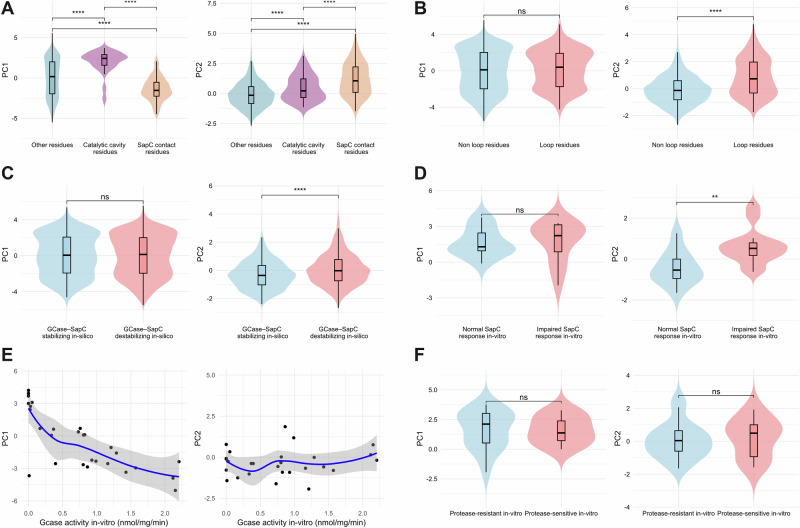
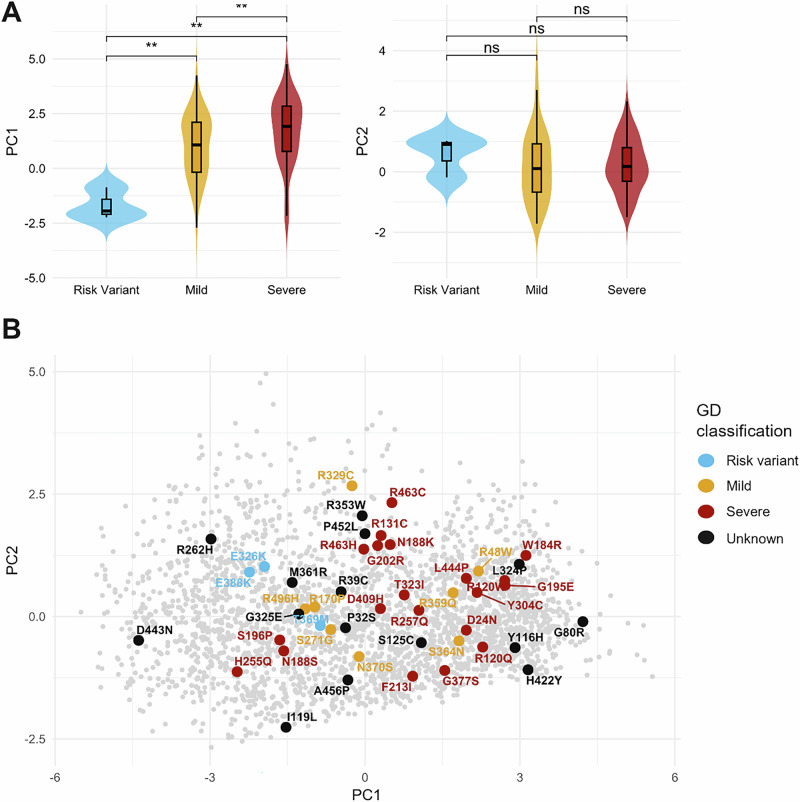
Bi-allelic pathogenic GBA1 variants cause Gaucher disease (GD), whereas certain heterozygous missense variants increase the risk of Parkinson's disease (PD), although the underlying mechanisms are unclear. Here, we classified GBA1 missense variants using predictive and structural scores, and analysed their associations with enzyme activity, Saposin C (SapC) interaction and PD progression in 639 patients with heterozygous GBA1 variants from five cohorts. Principal component analysis (PCA) identified two components: PC1, associated with reduced β-glucocerebosidase activity, the GD clinical severity classification, younger age at PD diagnosis, and faster cognitive and motor decline; and PC2, associated with surface-exposed, flexible regions involved in SapC interactions, younger age at PD diagnosis, and slightly with motor decline. These findings highlight that impaired SapC interactions, in addition to reduced activity, may contribute to PD severity in GBA1 variant carriers. This is relevant for therapeutic approaches aimed at stabilizing β-glucocerebosidase or enhancing its enzymatic activity in PD.


Conflict of interest statement

Competing interests: The authors declare no competing interests.

Figures

Fig. 1
Fig. 1
Flow chart.
Fig. 2
Fig. 2. Principal component analysis of GBA1 missense variants.
A Percentage of explained variance by the principal component analysis. B Variable plot of the first two principal components. DDG free energy difference, RSA relative solvent accessibility, DSA delta of solvent accessibility, LOF Loss of function.
Fig. 3
Fig. 3. Principal component classification of GBA1 missense variants by structural features and in vitro functional assays.
A Distributions of PC1 and PC2 scores for GBA1 missense variants stratified by structural spatial context: non-catalytic cavity/non–Saposin C contact residues (other residues, blue, n = 2659), catalytic cavity residues (purple, n = 96), and Saposin C contact residues (orange, n = 151). B Comparison of PC1 and PC2 distributions between loop residues (red, n = 220) and non-loop residues (blue, n = 2686). Loop regions are typically associated with increased flexibility and surface exposure. C in silico analysis of the GCase–Saposin C interface using AlphaFold3 predictions. Variants were classified as stabilizing (blue, n = 511) or destabilizing (red, n = 2395) based on predicted effects on protein–protein interactions. D In vitro Saposin C activation response among variants for which recombinant β-glucocerebosidase activity was measured in the presence or absence of Saposin C. Variants were grouped as responsive (blue, n = 11) or non-responsive (red, n = 14). E Relationship between PC scores and recombinant β-glucocerebosidase activity (n = 28). PC1 and PC2 scores were plotted against in vitro activity values. F Protease resistance analysis based on Cathepsin D digestion assays. Variants were classified as protease-resistant (blue, n = 18) or protease-sensitive (red, n = 9), reflecting differences in protein folding stability. Violin plots display the distribution density, with overlaid boxplots showing the median and interquartile range. Statistical significance was assessed using Wilcoxon rank-sum; ns = not significant, *P < 0.05, **P < 0.01, ***P < 0.001, ****P < 0.0001. Spearman’s correlation coefficient (R) is shown, with non-linear loess smoothing used to visualize trends. Shaded regions represent 95% confidence intervals.
Fig. 4
Fig. 4. Comparison of Gaucher disease and principal component classification of GBA1 missense variants.
A Gaucher disease classification according to PC1 and PC2, respectively. Variants are classified as risk variants (N = 3), mild (N = 55) or severe (N = 74). Statistical significance was assessed using Wilcoxon rank-sum; ns not significant, *P < 0.05, **P < 0.01, ***P < 0.001, ****P < 0.0001. B Plot of GBA1 missense variants according to PC1 and PC. Color key: Blue = Risk variant, Orange = Mild, Red = Severe.
Fig. 5
Fig. 5. Estimated marginal means of β-glucocerebosidase activity according to Gaucher disease and principal component classification.
These results are derived from linear mixed-effects models, where β-glucocerebrosidase activity is the dependent variable. A Estimated marginal means of β-glucocerebosidase activity (μmol/L/h) across Gaucher disease classification (risk variant, mild or severe). Pairwise comparisons of estimated means are shown with associated p values. B Relationship between β-glucocerebosidase activity and principal component 1 (PC1). Each dot represents an individual sample; the red line indicates the model-predicted slope with a 95% confidence interval. C Relationship between β-glucocerebosidase activity and principal component 2 (PC2). No significant association was observed. Gcase β-glucocerebosidase.
Fig. 6
Fig. 6. Estimated marginal means of age at diagnosis according to Gaucher disease and principal component classification.
These results are derived from linear mixed-effects models. A Estimated marginal means of age at diagnosis (in years) across Gaucher disease classification (risk variant, mild or severe). Pairwise comparisons of estimated means are shown with corresponding p values. B Relationship between age at diagnosis and principal component 1 (PC1). Each dot represents an individual; the red line shows the fitted slope with 95% confidence interval. C Relationship between age at diagnosis and principal component 2 (PC2), also showing model-estimated slope and confidence interval.
Fig. 7
Fig. 7. Estimated marginal means of MOCA score during follow-up according to Gaucher disease and principal component classification.
These results are derived from linear mixed-effects models. The estimated marginal means represent predicted slopes of cognitive decline (MoCA score). A Estimated marginal mean trajectories of MoCA scores over time by Gaucher disease classification (risk variant, mild or severe). A significant difference in cognitive decline slopes is observed between groups. (Color key: Blue = Risk variant, Orange = Mild, Red = Severe). B Predicted MoCA score change by PC1. Individuals with higher PC1 scores show significantly faster cognitive decline. (Color key: Green = Low tercile PC score, Blue = Medium tercile, Red = High tercile). C Predicted MoCA score change by PC2. No significant differences were detected. (Color key: Green = Low tercile PC score, Blue = Medium tercile, Red = High tercile). Shaded areas represent 95% confidence intervals. The estimated slopes reflect adjusted marginal means derived from the fitted LMMs.
Fig. 8
Fig. 8. Estimated marginal means of MDS-UPDRS III ON condition score during follow-up according to Gaucher disease and principal component classification.
These results are derived from linear mixed-effects models. The estimated marginal means represent predicted slopes of motor symptom progression (MDS-UPDRS III ON condition). A Predicted trajectories of MDS-UPDRS III scores over time by Gaucher disease classification (risk variant, mild or severe). A significant difference in motor progression slopes is observed across groups. (Color key: Blue = Risk variant, Orange = Mild, Red = Severe). B Predicted MDS-UPDRS III score change by PC1. Individuals with higher PC1 scores show significantly faster motor progression. (Color key: Green = Low tercile PC score, Blue = Medium tercile, Red = High tercile). C Predicted MDS-UPDRS III score change by PC2. Individuals with higher PC2 scores show a trend toward faster motor progression. (Color key: Green = Low tercile PC score, Blue = Medium tercile, Red = High tercile). Shaded areas represent 95% confidence intervals. The estimated slopes reflect adjusted marginal means derived from the fitted LMMs.

References

    1. Morris, H. R., Spillantini, M. G., Sue, C. M. & Williams-Gray, C. H. The pathogenesis of Parkinson’s disease. Lancet403, 293–304 (2024). - PubMed
    1. Kalia, L. V. & Lang, A. E. Parkinson’s disease. Lancet386, 896–912 (2015). - PubMed
    1. Aflaki, E., Westbroek, W. & Sidransky, E. The complicated relationship between Gaucher disease and Parkinsonism: insights from a rare disease. Neuron.93, 737–746 (2017). - PMC - PubMed
    1. Liou, B. et al. Combination of acid β-glucosidase mutation and Saposin C deficiency in mice reveals Gba1 mutation dependent and tissue-specific disease phenotype. Sci. Rep.9, 5571 (2019). - PMC - PubMed
    1. Platt, F. M., d’Azzo, A., Davidson, B. L., Neufeld, E. F. & Tifft, C. J. Lysosomal storage diseases. Nat. Rev. Dis. Prim.4, 1–25 (2018). - PubMed

LinkOut - more resources