. 2025 Aug 2;16(1):7115.
doi: 10.1038/s41467-025-62475-6.

Pericytes promote metastasis by regulating tumor local vascular tone and hemodynamics

Affiliations

Pericytes promote metastasis by regulating tumor local vascular tone and hemodynamics

Xiaobo Li et al. Nat Commun. .

Abstract

Hemodynamics are important for survival and extravasation of circulating tumor cells, whereas the effects of hemodynamics on tumor cell intravasation remain mostly unknown. Here, we show that colorectal cancer patients with liver metastasis are characterized by increased diameter and blood flow in the primary tumor compared with non-metastatic patients. A subpopulation of NKX2-3high tumor pericytes (TPCs) in the primary tumor is associated with hematogenous metastasis of patients. Mechanistically, long noncoding RNA NEAT1-enriched extracellular vesicles induce NKX2-3 upregulation in TPCs. NKX2-3 suppresses calcium influx in TPCs via PDE1C/cAMP/PKA signaling axis, inducing tumor vasodilation and increasing blood flux and vascular leakage. Genetic deletion of Nkx2-3 or pharmacological blocking the transcriptional activity of NKX2-3 in TPCs with designed peptide induce tumor local vasoconstriction and decrease blood flow to mitigate tumor metastasis. These findings reveal that TPCs-regulated vasodilation and hemodynamics facilitate tumor metastasis, and provide a potential prognostic marker and therapeutic strategy for tumor metastasis.


Conflict of interest statement

Competing interests: The authors declare no competing interests.

Figures
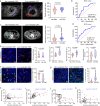
Fig. 1
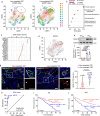
Fig. 1. Hemodynamic changes in primary tumor are associated with colorectal cancer liver metastasis.
a Doppler ultrasound images of blood flow signal derived from the primary tumor tissues of NM CRC (n = 45) and LM CRC patients (n = 45). The quantification of blood flow signal is shown (right). b ROC curve analysis of the blood flow signal in CRC patients (n = 90). c Representative CT images and quantification for blood flow signal in NM CRC (n = 49) and LM CRC patients (n = 44). d ROC curve analysis of the blood flow signal (small area emphasis value) in CRC patients (n = 93). Yellow circles indicate primary tumor region. e Immunofluorescence analysis of microvessel density, diameter, length, and surface area in the primary tumor of NM CRC (n = 49) and LM CRC patients (n = 44). Scale bar, 20 μm. f Immunofluorescence analysis of laminin+/VWF+ area per field in the primary tumor of NM CRC (n = 49) and LM CRC patients (n = 44). Scale bar, 20 μm. g Immunofluorescence analysis of CA9+/tumor area in the primary tumor regions derived from NM CRC (n = 49) and LM CRC patients (n = 44). Scale bar, 20 μm. Pearson correlation analysis of microvessel density (h), microvessel diameter (i), % of laminin+/VWF+ area (j), and % of CA9+/tumor area (k) with the signal of blood flow (small area emphasis value) in (c) (n = 93). Each sample in the violin plots represents data from an individual patient. P values were determined by two-tailed unpaired t-test, n denotes the number of patients. AUC area under curve, CRC colorectal cancer, CT computed tomography, LM CRC liver-metastatic colorectal cancer, NM CRC non-metastatic colorectal cancer, ROC receiver operating characteristic.
Fig. 2
Fig. 2. NKX2-3 is highly expressed in MAPs and related to colorectal cancer liver metastasis.
a t-SNE visualization of TPC subsets derived from primary tumor tissues of CRC patients with (n = 2) or without (n = 2) liver metastasis. b GO analysis of MAPs-enriched genes. c Dot plots of the regulon activities in MAPs. d t-SNE visualization of NKX2-3 expression in all TPC clusters. e Western blot assay for NKX2-3 expression in TPCNM and TPCLM. f qPCR analysis of NKX2-3 expression in TPCNM and TPCLM (n = 3, n denotes the number of independent experiments). g Immunofluorescence staining and quantification of the NKX2-3+ TPC ratio in tumor sections from CRC patients (n = 93). The white arrows indicate NKX2-3 staining in TPCs. Scale bar, 20 μm. Each sample in the violin plots represents data from an individual patient. h ROC curve analysis of the NKX2-3+ TPC ratio in CRC patients (n = 93). Kaplan–Meier analysis of OS (i) and DFS (j) in CRC patients with a high or low NKX2-3+ TPC ratio (optimal cutoff value of 44%, n = 93). P values were determined by two-tailed unpaired t-test (f, g), log-rank (Mantel-Cox) test (i, j), n denotes the number of patients. AUC area under curve, CRC colorectal cancer, GO gene ontology, MAPs metastasis-associated pericytes, OS overall survival, DFS disease-free survival, ROC receiver operating characteristic, TPC tumor pericyte. Western blot samples derive from the same experiment but different gels for NKX2-3, another for GAPDH was processed in parallel.
Fig. 3
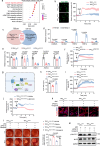
Fig. 3. NKX2-3 in TPCs inhibits cell contraction through suppressing the PDE1C/cAMP/PKA/Ca2+ axis.
a KEGG analysis of NKX2-3 peak genes derived from ChIP-seq in TPCNMNKX2-3. b Fluo-4AM fluorescence images and intensities in TPCNMVector and TPCNMNKX2-3. Scale bar, 20 μm. c Venn diagram showing the number of overlapped genes derived from NKX2-3-regulated genes and NKX2-3 peak genes associated with calcium signaling pathway. RNA-seq was performed on TPCLMgNKX2-3 (n = 3) vs TPCLMgNC (n = 3). d ChIP-qPCR analysis for the binding of NKX2-3 to the promoters of the indicated genes. e qPCR analysis for gene expression in NKX2-3-knockdown TPCs. f Differential changes of Fluo-4AM intensity in PDE1C-knockdown TPCLM. g Schematic diagram showing the intracellular PDE1C/cAMP/PKA/calcium signaling axis. Created in BioRender. Pan, J. (2025) https://BioRender.com/life0kp. h ELISA analysis of the cAMP concentration in NKX2-3-overexpressing TPCs with PDE1C-knockdown. i Fluo-4AM fluorescence analysis of intracellular calcium in NKX2-3-overexpressing TPCs with PDE1C-knockdown. j Fluo-4AM fluorescence assay for the intracellular calcium in TPCNMNKX2-3+siPDE1C treated with or without H89 2HCl (10 μM). k Immunofluorescence analysis of F-actin expression in TPCNMVector and TPCNMNKX2-3 (n = 3, n denotes the number of independent experiments). TPCNMNKX2-3 were transfected with siPDE1C and treated with verapamil (5 μM). Scale bar, 20 μm. l Representative images and quantification of collagen contraction induced by the indicated TPCNMVector and TPCNMNKX2-3. m Western blot analysis of MLC2 and p-MLC2Ser15 expression in TPCNMVector and TPCNMNKX2-3 as indicated in k. Data are presented as mean ± SEM (n = 3, n denotes the number of samples each group). P values were determined by Benjamini-Hochberg method following a two-sided hypergeometric test (a); by two-tailed unpaired t-test (d); by one-way ANOVA followed by Tukey’s post hoc test (e, h, l). BayK, (S)-(-)-Bay K8644; KEGG, kyoto encyclopedia of genes and genomes; NC negative control, TPC tumor pericyte. Western blot samples derive from the same experiment but different gels for MLC2, another for p-MLC2Ser15, and another for GAPDH was processed in parallel.
Fig. 4
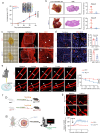
Fig. 4. Pericyte-specific deletion of Nkx2-3 facilitates tumor local vasoconstriction and inhibits tumor metastasis.
a Bioluminescence assay for tumor growth in PClin and PClin-KO mice orthotopic injected with MC-38-luc-LM3 cells. The luminescence of primary tumor was quantified. b H&E staining and quantification for the number and area of liver metastatic foci in tumor-bearing PClin and PClin-KO mice. The yellow and black dotted lines indicate the metastatic foci. Scale bar, 1 mm. c Representative images of orthotopic tumors post tissue clearing and stained tumor vessels derived from PClin and PClin-KO mice (n = 3, n denotes the number of independent experiments). Scale bar, 2 mm. The white arrows indicate tumor vessels with different diameters. d Immunofluorescence analysis of microvessel density and diameter in orthotopic tumors. Scale bar, 25 μm. The white lines indicate vessel diameters. e Schematic diagram of the vasoconstriction assay performed by two-photon excited fluorescence microscopy (left, created in BioRender. Pan, J. (2025) https://BioRender.com/life0kp). Representative images and quantification of tumor vessel diameter after exposure to U46619 for 10 min (right). Scale bar, 5 μm. The white arrows and lines indicate vessel diameters. f Schematic depicting the experimental design, whereby PClin and PClin-KO mice were intravenously injected with AAV expressing GCaMP6 to indicate intracellular calcium signaling, and tumor vessels were exposed to U46619 and detected by intravital imaging. Created in BioRender. Pan, J. (2025) https://BioRender.com/life0kp. g Representative images and quantification of GCaMP6 expression in TPCs from PClin-GCaMP6 and PClin-KO-GCaMP6 mice treated with U46619. Scale bar, 20 μm. Yellow circles indicate GCaMP6 expression in TPCs, white arrows and lines indicate vascular diameter in mouse tumor. Data are presented as mean ± SEM (n = 6, n denotes the number of samples each group). P values were determined by two-tailed unpaired t-test. PC pericyte.
Fig. 5
Fig. 5. NKX2-3 in TPCs facilitates tumor metastasis by increasing blood flow and vessel permeability.
a Representative two-photon images showing the dextran signal in blood vessels derived from PClin and PClin-KO mice (the area denoted with a yellow box is enlarged). The midline of each vessel (yellow line) was chosen as the measurement plane for a continuous line scan (up), and the direction of blood flow is indicated by red arrow. Representative images of the line scan and quantification of blood velocity (bottom). Scale bar, 100 μm.b Intravital imaging to evaluate the change of RBC velocity and vessel diameter post-U46619 treatment in orthotopic tumors derived from PClin and PClin-KO mice. Scale bar, 20 μm. c MRI images of tumors derived from PClin and PClin-KO mice (left). Quantification of the f and D* values is shown (right). The white rings indicate the tumors. Scale bar, 10 mm. d Laser speckle contrast imaging and quantification of blood flux in PClin and PClin-KO mice. The yellow and white circles indicate the tumor area. Scale bar, 2 mm. e Immunofluorescence staining and quantification of ZO-1 (red) expression on CD31 positive endothelial cells derived from orthotopic tumor sections. Scale bar, 20 μm. f Immunofluorescence analysis of FITC-dextran 40 kDa (green) surrounding vessels labeled with CD31 in orthotopic tumor sections. Scale bar, 20 μm. g Schematic diagram describing the microfluidic vessel chip. Created in BioRender. Pan, J. (2025) https://BioRender.com/life0kp. h Immunofluorescence assay for the transendothelial migration of HCT116 cells. White dotted lines indicate the porous membrane between the top channel and bottom channel. Data are presented as mean ± SEM (n = 3, n denotes the number of samples each group). Scale bar, 200 μm. i Intravital imaging evaluating tumor cell intravasation in PClin-KO mice before and after exposure to 10 μM nitroprusside (n = 3, n denotes the number of independent experiments). Scale bar, 20 μm. Data are presented as mean ± SEM (n = 6, n denotes the number of samples each group). P values were determined by two-tailed unpaired t-test. PC pericyte, RBC red blood cell.
Fig. 6
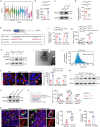
Fig. 6. Tumor derived EVs induce the expression of NKX2-3 in TPCs through the lncRNA NEAT1/miR-769-5p signaling axis.
a Box plot for the level of NEAT1 in all TPC subsets. Box plots show the median (center line), 25th/75th percentiles (box bounds), smallest/largest values within 1.5×IQR (whiskers), and outliers beyond whiskers (dots). b, c qPCR and Western blot analysis for NKX2-3 expression in NEAT1-overexpressing TPCNM. d miR-769-5p level in NEAT1-overexpressing TPCNM. e Schematic representation of the miR-769-5p binding sties in NKX2-3. f Luciferase reporter assay evaluating the binding of the miR-769-5p mimic to NKX2-3. g qPCR analysis of miR-769-5p and NKX2-3 in TPCs treated with the miR-769-5p mimic. h Protein expression of NKX2-3 in the indicated TPCs. i Representative TEM phase images of DLD-1 EVs (n = 3, n denotes the number of independent experiments). Scale bar, 100 nm. j Enrichment diameter distribution of DLD-1 EVs. k Immunofluorescence analysis for F-actin in TPCNM treated with DLD-1 EVs. Scale bar, 10 μm. l, m Gene and protein expression in TPCNM treated with DLD-1 EVs. n Protein expression in Rab27A-knockdown DLD-1 cells. Western blot samples derive from the same experiment but different gels for Rab 27A, another for GAPDH was processed in parallel. o Schematic diagram of the co-culture model (left). Gene expression in TPCNM treated with EVs derived from Rab27A-knockdown DLD-1 cells (right). Created in BioRender. Pan, J. (2025) https://BioRender.com/life0kp. p FISH analysis of NEAT1 expression in primary tumor of CRC patients. The white arrows indicate NEAT1 staining in TPCs. Scale bar, 20 μm. Each sample in the violin plots represents data from an individual patient (n = 15 each group). q qPCR analysis of NEAT1 in the blood EVs derived from CRC patients (n = 5 each group). Data are presented as mean ± SEM (n = 3, n denotes the number of samples each group). P values were determined by two-tailed unpaired t-test (b, d, f, l, p, q); one-way ANOVA followed by Tukey’s post hoc test (g, o). CTL control, EVs extracellular vesicles, FISH fluorescence in situ hybridization, IQR interquartile range, Mut mutant, NC negative control, TPC tumor pericyte, Wt wildtype. Western blot samples derive from the same experiment but different gels for NKX2-3, another for GAPDH was processed in parallel.
Fig. 7
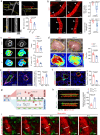
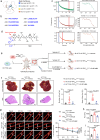
Fig. 7. Targeting NKX2-3high TPCs inhibits CRCLM by inducing vasoconstriction.
a Predicted protein structure of NKX2-3 by AlphaFold DB. b Amino-acid sequences encoding oligopeptides NB1-NB6. c MST analysis for the interaction of PDE1C with NB2 and NKX2-3 (n = 3). d Structure of Z-GP-NB2. e Schematic diagram of the animal experiments. Created in BioRender. Pan, J. (2025) https://BioRender.com/life0kp. f Representative images of whole livers and H&E analysis of liver metastatic foci derived from mice bearing HCT116 orthotopic xenografts (n = 6). The yellow and black dotted lines indicate the metastatic foci. Scale bar, 1 mm. g Representative images and quantification of vessel diameter after exposure to U46619 for 10 min (right). Scale bar, 5 μm. The white arrows and lines indicate vessel diameters (n = 6). h Laser speckle assay for blood flow in orthotopic tumors derived from mice treated with or without Z-GP-NB2 (n = 6). i MRI examination of tumors derived from HCT116 xenograft-bearing mice with indicated treatment. Quantification of Ktrans values is shown (n = 3). Data are presented as mean ± SEM, n denotes the number of samples each group. P values were determined by one-way ANOVA followed by Tukey’s post hoc test. I.P. intraperitoneal, TPC tumor pericyte.

References

    1. Gerstberger, S., Jiang, Q. & Ganesh, K. Metastasis. Cell186, 1564–1579 (2023). - PMC - PubMed
    1. Lambert, A. W., Pattabiraman, D. R. & Weinberg, R. A. Emerging biological principles of metastasis. Cell168, 670–691 (2017). - PMC - PubMed
    1. Fares, J., Fares, M. Y., Khachfe, H. H., Salhab, H. A. & Fares, Y. Molecular principles of metastasis: a hallmark of cancer revisited. Signal Transduct. Target. Ther.5, 28 (2020). - PMC - PubMed
    1. Harney, A. S. et al. Real-time imaging reveals local, transient vascular permeability, and tumor cell intravasation stimulated by TIE2hi macrophage-derived VEGFA. Cancer Discov.5, 932–943 (2015). - PMC - PubMed
    1. Ganesh, K. & Massagué, J. Targeting metastatic cancer. Nat. Med.27, 34–44 (2021). - PMC - PubMed

MeSH terms

Grants and funding

LinkOut - more resources