. 2025 Aug 2;16(1):586.
doi: 10.1038/s41419-025-07911-7.

Enlarged PML-nuclear bodies trigger conflicting cell cycle signal-mediated cytotoxicity in leukemia cells

Affiliations

Enlarged PML-nuclear bodies trigger conflicting cell cycle signal-mediated cytotoxicity in leukemia cells

Tomohisa Baba et al. Cell Death Dis. .

Abstract

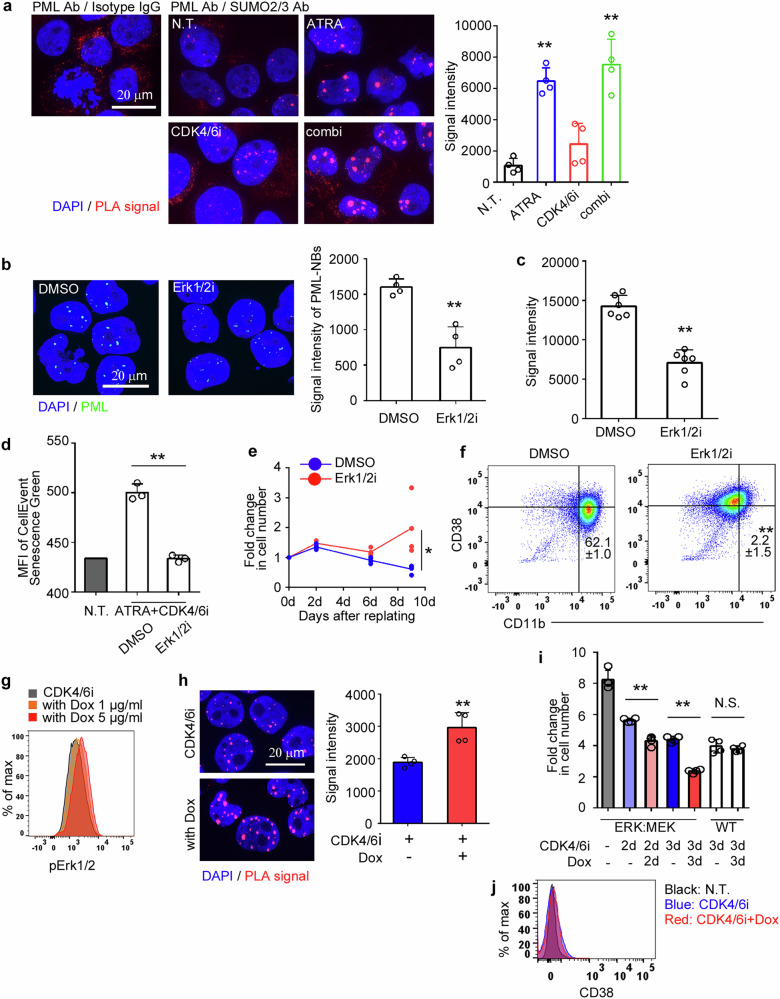
Accumulating evidence suggests that mitogenic signaling during cell cycle arrest can lead to severe cytotoxic outcomes, such as senescence, though the underlying mechanisms remain poorly understood. Here, we explored the link between cell cycle dynamics and the formation of PML-nuclear bodies (PML-NBs), intranuclear structures known to mediate cellular stress responses. Our findings demonstrate that PML-NBs increase their number during interphase arrest. Moreover, the activation of mitogenic ERK signaling by all-trans retinoic acid (ATRA) during CDK4/6 inhibitor-induced cell cycle arrest synergistically enhances the formation of larger PML-NBs by associating with SUMO. This enlargement, triggered by the simultaneous engagement of opposing cell cycle signals, leads to potent cytotoxicity accompanied by either terminal differentiation or apoptosis, depending on the cell type, across multiple acute myeloid leukemia (AML) cell lines. Importantly, in an AML mouse model, this combination treatment significantly improved therapeutic efficacy with minimal effects on normal hematopoiesis. Our results introduce conflicting cell cycle signal-induced cytotoxicity as a promising therapeutic strategy for AML.


Conflict of interest statement

Competing interests: The authors declare no competing interests. Ethics approval and consent to participate: All methods were performed in accordance with the relevant guidelines and regulations. The animal studies were approved by the Committee of Laboratory Animals of Kanazawa University (AP-214222). No studies including human subjects were performed in this manuscript.

Figures

Fig. 1
Fig. 1. ATRA-induced myeloid differentiation and PML-NB formation in APL cell line NB4.
NB4 and HL60 cell lines were treated with 1 μM ATRA. a The expression of CD38 and CD11b on non-treated cells (black dots) and cells treated with ATRA for 24 h (blue dots) or 48 h (red dots) are shown. Representative data from three independent experiments are shown. b NBT staining of NB4 and HL60 cells 48 h after treatment with ATRA. DMSO-treated cells served as controls. Representative images and mean + SD of the percentage of NBT-positive cells, calculated from eight randomly selected fields across three independent experiments, are shown. c Cell growth in drug-free medium following prior incubation with ATRA for 24 or 48 h (n = 4). DMSO-treated cells for 24 h served as controls. The fold change in cell number was calculated by dividing the values at each time point by the values at day 0. d Immunofluorescent staining for PML-NBs in NB4 and HL60 cells 48 h after treatment with ATRA. DMSO-treated cells were used as controls. Representative images and mean + SD of the number of PML-NBs per nucleus are shown (n = 4). **P < 0.01; N.S., no significant difference (two-sided Student’s t-test).
Fig. 2
Fig. 2. PML-NBs increased with cell cycle arrest during interphase in HL60 cells.
a Cell cycle status was assessed 24 h post-treatment with CDK4/6i, CDK1i, or serum-free medium, as well as at the indicated time points following incubation in drug-free medium after a 24 h prior treatment with CDK1i. Representative data from three independent experiments are shown. b, c Immunofluorescent staining for PML-NBs was performed at the time points indicated in (a). Representative images and the mean + SD of the number of PML-NBs per nucleus are shown in d (n = 4). **P < 0.01; *P < 0.05 (Tukey–Kramer’s test).
Fig. 3
Fig. 3. Combined treatment with CDK4/6i and ATRA induces the irreversible cell growth arrest in HL60 cells through a distinctive pattern of PML-NB formation.
HL60 cells were treated with 1 μM CDK4/6i and/or 1 μM ATRA, with non-treated cells serving as controls. a The expression levels of CD38 and CD11b in HL60 cells were assessed at 24 h and 48 h post-treatment with CDK4/6i (red dots), ATRA (blue dots), or the combination of both drugs (green dots). Non-treated cells are represented by black dots. Representative data from three independent experiments are shown. b Cell cycle status was evaluated after drug treatment and 48 h after drug removal. Representative images and mean + SD of percentage of cells in G1 phase are shown (n = 3). c Cell growth was measured in drug-free medium following the indicated period of prior drug treatment (n = 4). The fold change in cell number was calculated by dividing the values at each time point by the values at day 0. d Immunofluorescent staining for PML-NBs was performed 48 h after drug treatment. Representative images and the mean + SD of the number of PML-NBs per nucleus and the average of their signal intensity are shown (n = 4). e Proliferation of shControl- and shPML-transduced HL60 cells was assessed in drug-free medium following 48 h of prior CDK4/6i+ATRA treatment (n = 4). The fold change in cell number was calculated by dividing the values at each time point by the values at day 0. f The expression of CD38 and CD11b on shControl- and shPML-transduced HL60 cells 48 h after CDK4/6i+ATRA treatment. The mean ± SD of the percentage of CD11bhighCD38low cells is shown (n = 3). g, h Cell number and apoptosis induction were assessed in PML-specific gRNA transduced MOLM-13 cells 48 h after CDK4/6i+ATRA treatment. The fold changes were calculated by dividing with the values of non-treated cells. The mean + SD from three independent experiments is shown. **P < 0.01; *P < 0.05; N.S., no significant difference (Tukey–Kramer’s test for (b); Dunnett’s test for (d, e); two-sided Student’s t-test for (g, h).
Fig. 4
Fig. 4. Increased PML-NBs under conditions of cell cycle arrest are multimerized by mitogenic ERK signaling.
a Direct interaction of PML with SUMO was assessed at 48 h post-treatment with ATRA, CDK4/6i, or the combination of both drugs using PLA in HL60 cells. Representative images and the mean + SD of the signal intensity of PLA foci are shown (n = 4). HL60 cells were pre-treated with 1 μM ERK1/2i for 10 min, followed by treatment with CDK4/6i+ATRA in the presence (b, c, d, and f) or absence (e) of 1 μM ERK1/2i. Immunofluorescent staining was performed to detect PML-NBs (b), Direct interaction of PML with SUMO was assessed (c), β-galactosidase activity was measured (d), cell growth was evaluated after drug removal (e), and the expression of CD38 and CD11b was analyzed 48 h after drug treatment (f). Representative images and/or the means + SD are shown, which were calculated from three independent experiments (d, f), four independent experiments (b, e), and six randomly selected fields across three independent experiments (c). g Phosphorylation of ERK1/2 was examined 24 h after doxycycline treatment in HL60 cells transduced with pCWXPGR-pTF-ERK:MEK. Transfected HL60 cells were treated with CDK4/6i in the presence or absence of 5 μg/ml doxycycline. h Direct interaction of PML with SUMO was assessed 24 h after drug treatment, with representative images and the mean + SD of the signal intensity of PLA foci presented. i Cell proliferation was measured 48 h after drug removal, and the fold change in cell number was calculated relative to day 0. Parental HL60 cells were used as a wild type (WT) control. The means + SD were calculated from four independent experiments. j CD38 expression was assessed 72 h after drug treatment. **P < 0.01; *P < 0.05; N.S. no significant difference (Dunnett’s test for a; two-sided Student’s t-test for (b–f, and h; Tukey–Kramer’s test for i).
Fig. 5
Fig. 5. Combined treatment with CDK4/6i and ATRA suppresses de novo protein synthesis and concurrent recruitment of histone chaperones into PML-NBs.
HL60 cells were treated with CDK4/6i and/or ATRA, with non-treated cells serving as controls. Molecular interactions of DAXX (a), ATRX (b), and HIRA (c) with PML were assessed 48 h after drug treatment using PLA. Representative images and the means + SD from six randomly selected fields across three independent experiments are shown. d, e Gene Set Enrichment Analysis (GSEA) was performed using gene sets associated with de novo protein synthesis-related GO terms (“RNA splicing” and “translation”). Comparisons were made between non-treated cells and combined drug-treated cells (d), as well as between CDK4/6i-treated cells and combined drug-treated cells (e). Normalized enrichment scores (NES) and q-values were calculated from three independent experiments. f Relative mRNA expression levels of POLR1B and POLR1G (n = 3). g Chromatin deposition of H3.3 and H3K9me3 at the POLR1B and POLR1G loci. Data representing the deposition at the transcription start site (TSS) regions, which were absent in control cells, are highlighted in green (H3.3) and red (H3K9me3). h, i De novo protein synthesis in shControl-, shPML-, and shATRX-transduced cells was assessed 48 h after CDK4/6i+ATRA treatment using the Click-iT HPG Alexa Fluor Protein Synthesis Assay. Inhibition of protein synthesis was calculated by dividing the MFI of drug-treated cells by that of untreated cells. Representative data and the mean + SD are shown (n = 3). **P < 0.01 (Tukey–Kramer’s test for ac and f; two-sided Student’s t-test for h, i).
Fig. 6
Fig. 6. Anti-AML cell specific therapeutic effect of combined treatment with CDK4/6i and ATRA in the AML mouse model.
a Schematic representation of the experimental design for the combined treatment with CDK4/6i and ATRA in nude mice bearing subcutaneous tumor of scramble- or gPML-transduced MOLM-13. Each treatment group consisted of five mice. b The size was calculated using the formula (volume = length × width2 /2) and is presented accordingly. c Schematic representation of the experimental design for the combined treatment with CDK4/6i and ATRA in mice bearing AML. Seven mice were treated with DMSO (control), CDK4/6i alone, or ATRA alone. Eight mice received the combination treatment. d The number of WBCs and (e) GFP+ AML cells in the PB were evaluated 28 days after AML cell transplantation. f Survival rates of mice bearing AML. g Schematic representation of the experimental design for the combined treatment with CDK4/6i and ATRA in healthy mice. Four mice were treated with either DMSO or the combination of CDK4/6i and ATRA. h Gating strategy for classifying each indicated HSC population, adjusted based on representative data obtained 2 days after tamoxifen injection. The number of RBCs (i), WBCs (j), and platelets (k) were evaluated 24 h after the last drug administration. l The number of HSCs was calculated as follows: total BM cells × proportion of lineage-c-kit+ZsGeen+ cells. m HSC stability was calculated using the following formula: the number of tdTomato+ZsGreen+ cells / (the number of tdTomato+ZsGreen+ cells + tdTomato+ZsGreen cells). **P < 0.01; *P < 0.05; N.S. no significant difference (Dunnett’s test for d and e; log-rank test for f; two-sided Student’s t-test for b, im).

Similar articles

References

    1. Blagosklonny MV. Cell senescence, rapamycin and hyperfunction theory of aging. Cell Cycle. 2022;21:1456–67. - PMC - PubMed
    1. Corpet A, Kleijwegt C, Roubille S, Juillard F, Jacquet K, Texier P, et al. PML nuclear bodies and chromatin dynamics: catch me if you can!. Nucleic Acids Res. 2020;48:11890–912. - PMC - PubMed
    1. Salomoni P, Pandolfi PP. The role of PML in tumor suppression. Cell. 2002;108:165–70. - PubMed
    1. Ferbeyre G, de Stanchina E, Querido E, Baptiste N, Prives C, Lowe SW. PML is induced by oncogenic Ras and promotes premature senescence. Genes Dev. 2000;14:2015–27. - PMC - PubMed
    1. Pearson M, Carbone R, Sebastiani C, Cioce M, Fagioli M, Saito S, et al. PML regulates p53 acetylation and premature senescence induced by oncogenic Ras. Nature. 2000;406:207–10. - PubMed

MeSH terms