Spatiotemporal evolution of HCV burden among women of reproductive age: a multinational age-period-cohort analysis
- PMID: 40753224
- PMCID: PMC12317561
- DOI: 10.1186/s12985-025-02869-6
Spatiotemporal evolution of HCV burden among women of reproductive age: a multinational age-period-cohort analysis
Abstract
Objective: To study the epidemiology and trends of HCV infection among women aged 15-49, this research aims to inform public health strategies and reduce its global impact by addressing maternal and child transmission risks.
Design: This research analyzed GBD data (1990-2021) on HCV in women aged 15-49, examining ASIR, ASPR, ASMR, and ASDR trends by region and age. APC and Bayesian models predicted future trajectories to guide public health policies.
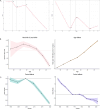
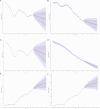
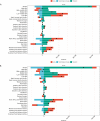
Results: From 1990 to 2021, the global burden of hepatitis C virus (HCV) among women aged 15 - 49 witnessed a downward trend. The incidence rate (5.46 per 100,000) and mortality rate (0.068 per 100,000) of acute HCV were notably lower than those of chronic HCV, which stood at an incidence rate of 29.92 per 100,000 and a mortality rate of 1.42 per 100,000. In 2021, regions with a low Sociodemographic Index (SDI) endured the heaviest burden. Oceania, Central Asia, Eastern Europe, and several other regions experienced an upward trend in acute HCV cases; meanwhile, the number of chronic HCV cases increased in most regions, with the exception of Australasia. Pakistan had the highest HCV burden globally. Projections indicate that over the next decade, both the incidence and mortality rates of HCV will continue to decline, yet the total number of cases is expected to rise.
Conclusion: This study reveals the complex epidemiological landscape of acute and chronic hepatitis C in women of reproductive age globally. Despite the anticipated decline in standardized incidence and mortality rates of acute and chronic hepatitis C among women of reproductive age worldwide in the coming decade, the actual number of cases continues to increase annually. This underscores the substantial challenges faced by the World Health Organization's goal of eliminating HCV infection by 2030.
Keywords: Age-Period-Cohort Analysis; Bayesian Projections; GBD; Hepatitis C; Women of Childbearing Age.
© 2025. The Author(s).
Conflict of interest statement
Declarations. Competing interests: The authors declare no competing interests.
Figures


Similar articles
-
Burden of knee osteoarthritis in China and globally: 1990-2045.BMC Musculoskelet Disord. 2025 Jul 1;26(1):582. doi: 10.1186/s12891-025-08858-8. BMC Musculoskelet Disord. 2025. PMID: 40598022 Free PMC article.
-
The epidemiological trends of inflammatory bowel disease among women of reproductive age: a global analysis from 1990 to 2021.Immunol Res. 2025 Jun 27;73(1):101. doi: 10.1007/s12026-025-09658-x. Immunol Res. 2025. PMID: 40576854
-
Trends and gender disparities in the burden of rheumatoid arthritis in Pakistan from 1990 to 2021.Sci Rep. 2025 Jul 1;15(1):21667. doi: 10.1038/s41598-025-05627-4. Sci Rep. 2025. PMID: 40592985 Free PMC article.
-
NIH Consensus Statement on Management of Hepatitis C: 2002.NIH Consens State Sci Statements. 2002 Jun 10-12;19(3):1-46. NIH Consens State Sci Statements. 2002. PMID: 14768714
-
National and subnational burden of brain and central nervous system cancers in China and global from 1990 to 2021: results from the global burden of disease study 2021.Arch Public Health. 2025 Jul 28;83(1):195. doi: 10.1186/s13690-025-01683-4. Arch Public Health. 2025. PMID: 40722045 Free PMC article.
References
-
- The Lancet. Towards elimination of viral hepatitis by 2030[J]. Lancet. 2016;388(10042):308. - PubMed
-
- Domínguez-Rodríguez S, Prieto L, Fernández McPhee C, Illán-Ramos M, Beceiro J, Escosa L, Muñoz E, Olabarrieta I, Regidor FJ, Roa MÁ, Viñuela Beneítez MDC, Guillén S, Navarro-Gómez ML, Ramos Amador JT, Madrid Cohort of HIV-infected mother-infant pairs. Perinatal HCV transmission rate in HIV/HCV coinfected women with access to ART in Madrid, Spain. PLoS One. 2020;15(4): e0230109. - PMC - PubMed
-
- Bernstein HB, Dunkelberg JC, Leslie KK. Hepatitis c in pregnancy in the era of direct-acting antiviral treatment: potential benefits of universal screening and antepartum therapy. Clin Obstet Gynecol. 2018;61(1):146–56. - PubMed
MeSH terms
LinkOut - more resources
Full Text Sources
Medical

