. 2025 Aug 2;25(1):273.
doi: 10.1007/s10238-025-01826-5.

Identification of prognostic genes related to T cell proliferation in papillary thyroid cancer based on single-cell RNA sequencing and bulk RNA sequencing data

Affiliations

Identification of prognostic genes related to T cell proliferation in papillary thyroid cancer based on single-cell RNA sequencing and bulk RNA sequencing data

Qingkai Meng et al. Clin Exp Med. .

Abstract

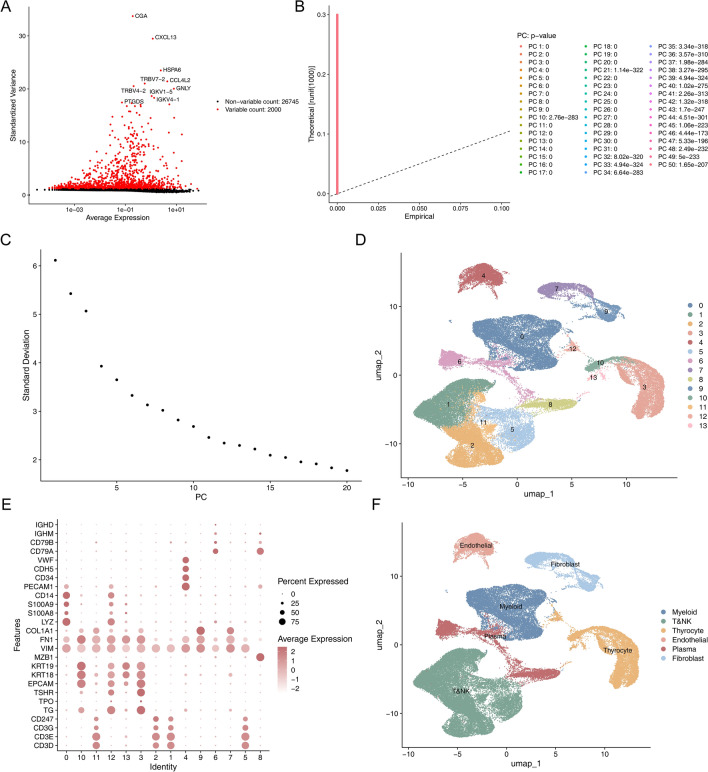
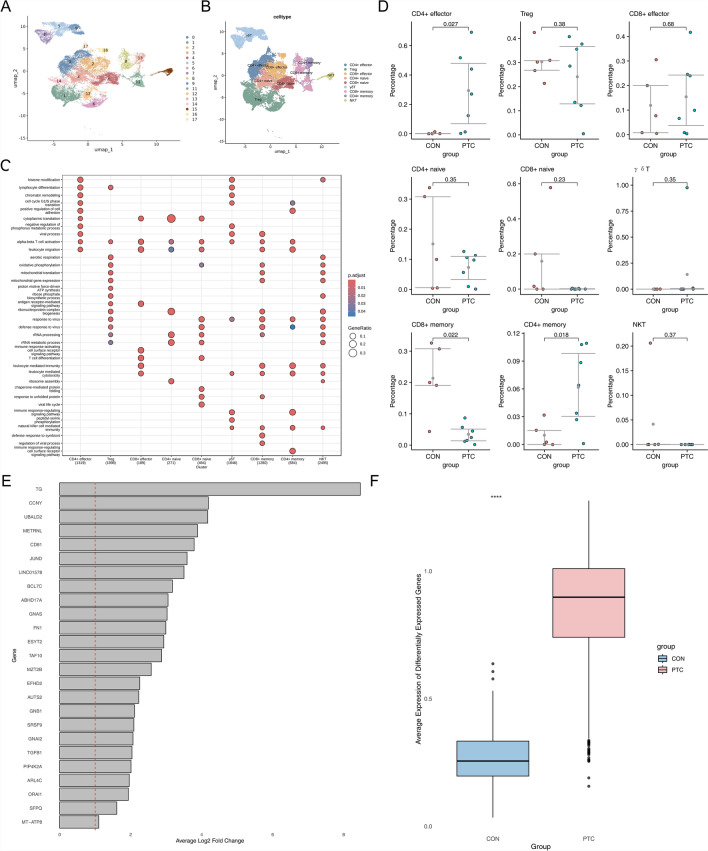
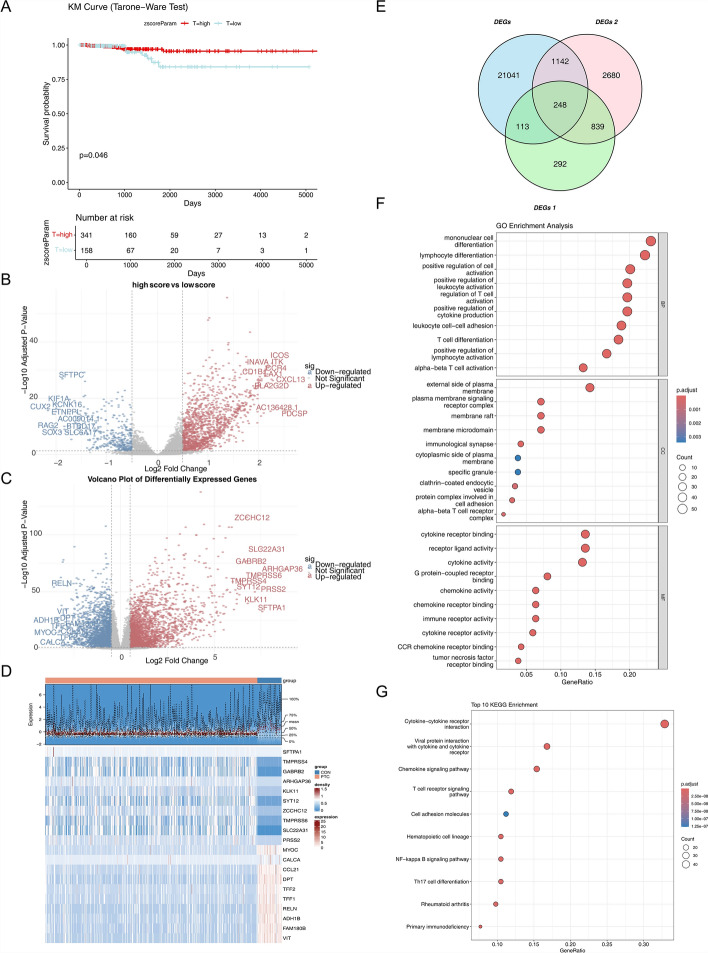
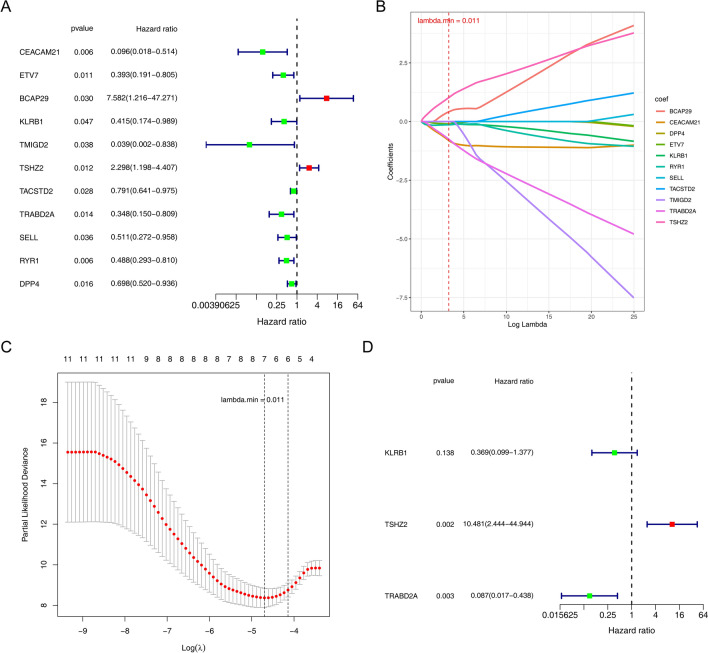
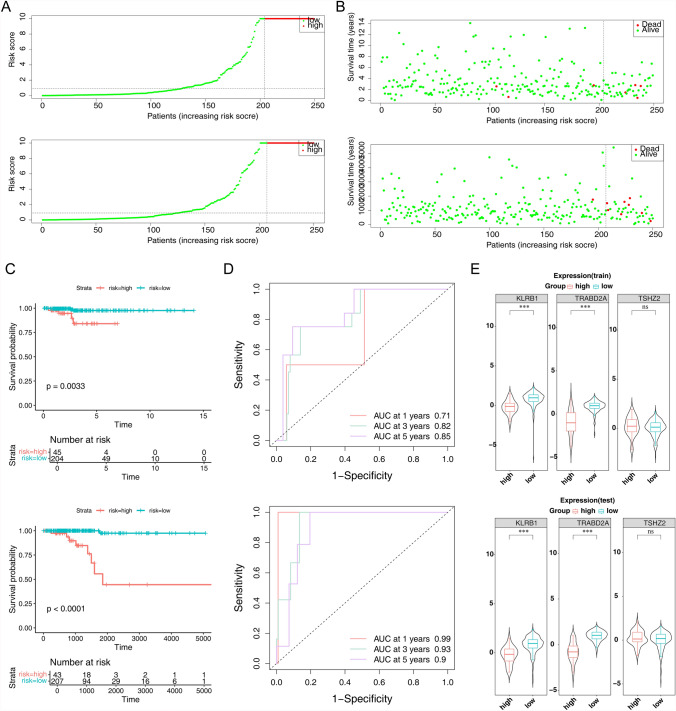
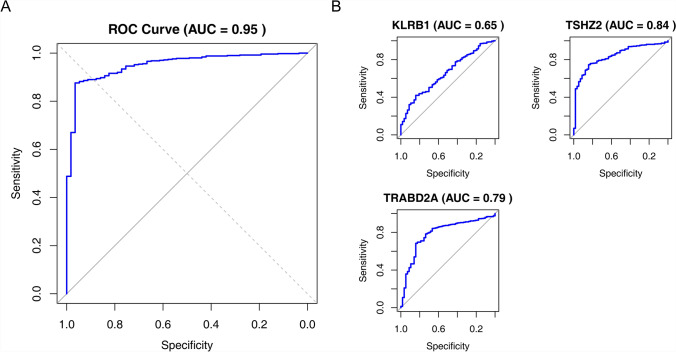
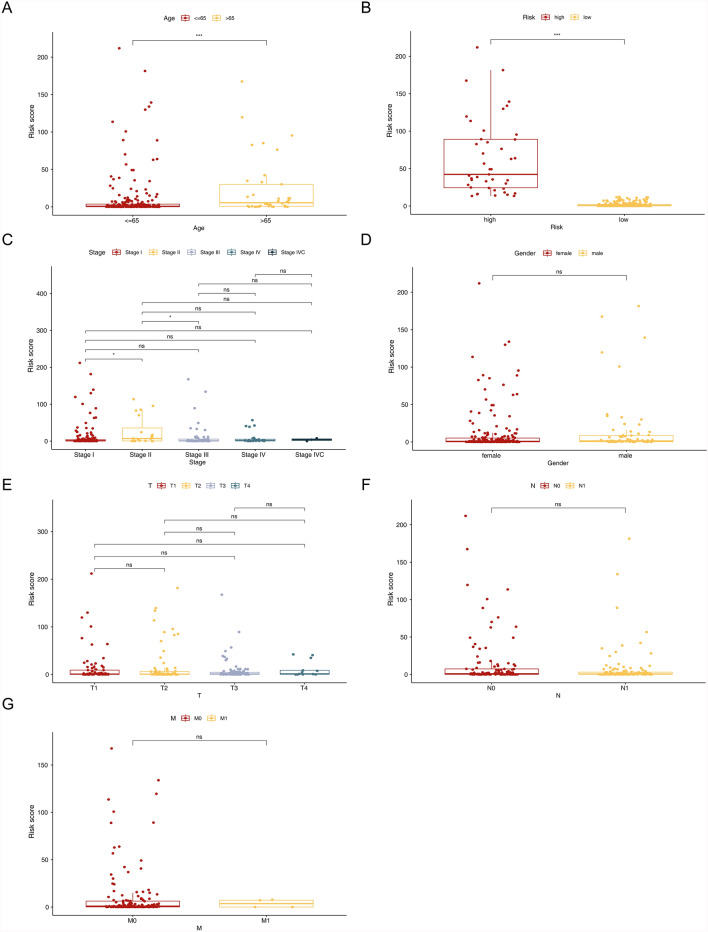
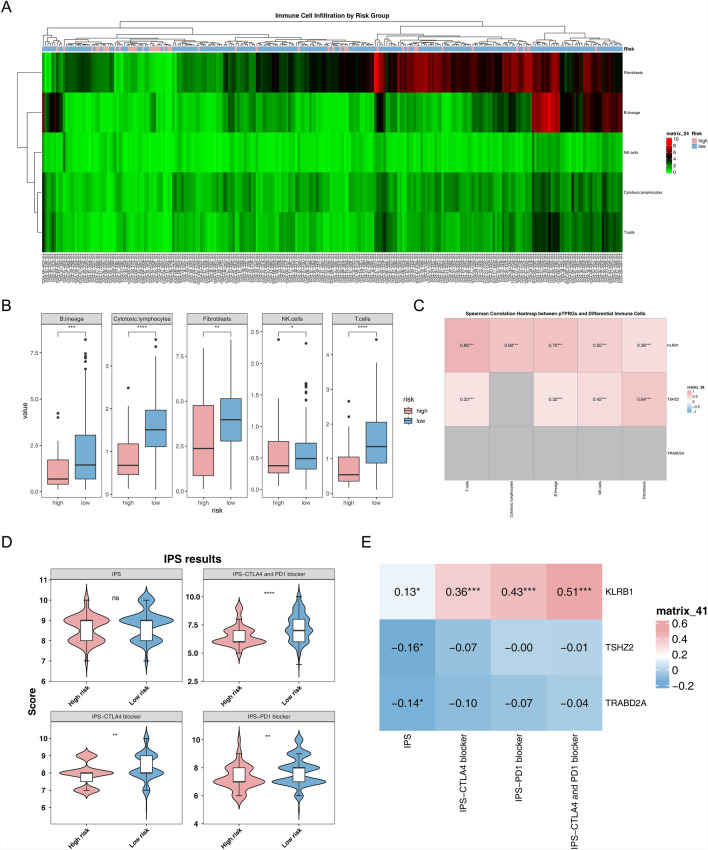
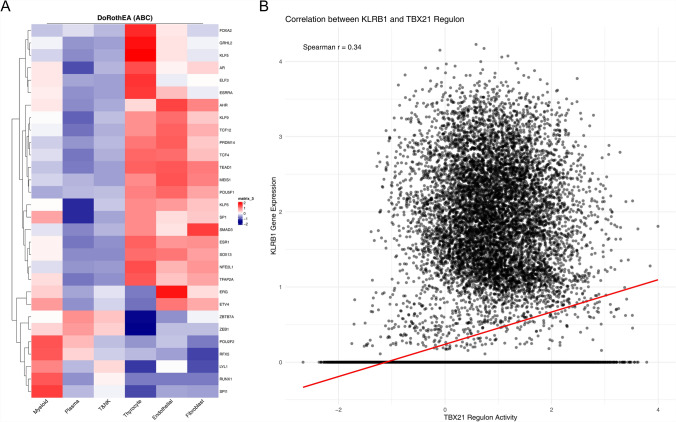
Papillary thyroid carcinoma (PTC) is the main pathological subtype of thyroid cancer. Given the strong association between T cells and PTC, this study focused on the prognostic value and potential molecular mechanisms of T cell proliferation-related genes (TPRGs) in PTC. ScRNA-seq data were analyzed to identify key cells and subpopulations based on public databases. Candidate genes were determined by intersecting differentially expressed genes (DEGs) from differential expression analysis of key subpopulations, high- and low-TPRGs score groups, and bulk RNA-seq data. Prognostic genes were then determined via Cox regression and a machine learning algorithm. A risk model was formed. PTC patients were grouped into high-risk and low-risk groups by risk score. Subsequently, the immune microenvironment was analyzed. Finally, cell communication analysis and pseudotime analysis were accomplished. T/NK cells were selected as key cells. Moreover, CD4+ memory cells were selected as the key subpopulation. Meanwhile, KLRB1, TSHZ2, and TRABD2A were spotted as prognostic genes. The risk model had better prognostic value. Additionally, 5 DICs were spotted in two risk groups. Besides, the scores of IPS-CTLA4 and PD-L1 blocker, IPS-CTLA4 blocker, and IPS-PD-1 blocker were lower in the HRG group. In addition, the most substantial receptor-ligand interaction in T/NK cells was found to be CLEC2C-KLRB1. Moreover, as T/NK cells differentiated, the expression level of KLRB1 was observed to rise slowly at first and then decline rapidly. KLRB1, TSHZ2, and TRABD2A were spotted as prognostic genes, providing new PTC prognosis and treatment strategies.

Keywords: Immune microenvironment; Papillary thyroid cancer; Prognostic genes; T cell proliferation.


Conflict of interest statement

Declarations. Conflicts of interest: The authors declare no competing interests. Ethics approval: Not applicable. Consent to participate: Not applicable. Consent to publish: Not applicable.

Figures

Fig. 1
Fig. 1
Identification and clustering of key cell types from scRNA-seq data. A Variance vs. average expression plot showing the distribution of 2,000 highly variable genes (HVGs) selected for further analysis, with red dots indicating HVGs. B Theoretical vs. empirical PCA plot comparing the cumulative distributions of the first 34 principal components (PCs), with significant p-values marked for each PC. C A Scree plot displays the standard deviation of the first 20 PCs, indicating the selection of the first few PCs for analysis. D UMAP clustering plot visualizing 14 distinct clusters from scRNA-seq data, with each cluster labeled numerically. E Dot plot of marker gene expression across cell clusters, where dot size represents the percentage of cells expressing the gene and color indicates the average expression level. F UMAP plot with cell type annotation, showing myeloid, T&NK, thyrocyte, endothelial, plasma, and fibroblast cell types
Fig. 2
Fig. 2
Analysis of T cell subpopulations and differentially expressed genes. A UMAP plot showing the clustering of T cell subpopulations across the dataset, with each color representing a distinct subpopulation. B UMAP plot annotated with cell types, highlighting the different T cell subpopulations, including CD4+ effector, CD4+ memory, CD8+ memory, and others. C Gene Ontology (GO) enrichment analysis of differentially expressed genes (DEGs) across T cell subpopulations. The size of each circle represents the gene ratio, and the color intensity reflects the significance of the P-value. D Scatter bar chart showing the comparison of the percentage of specific T cell subpopulations between control (CON) and PTC groups. Significant differences are indicated by p-values. E Bar plot showing the top differentially expressed genes (DEGs) in T cell subpopulations, ranked by average log2 fold change. F Box plot displaying the average expression levels of DEGs in T cell subpopulations between the CON and PTC groups
Fig. 3
Fig. 3
Identification of prognostic genes and functional enrichment analysis. A Kaplan–Meier curve showing survival differences between high and low-risk groups based on the risk model, with statistical significance indicated by the Tarone-Ware test (P = 0.046). B Volcano plot comparing differential DEGs between high and low-risk groups, highlighting upregulated (red) and downregulated (blue) genes. C The volcano plot of DEGs between PTC and control groups shows significant upregulation (red) and downregulation (blue) of genes. D Expression heatmap and distribution of DEGs across control (CON) and PTC groups, with individual gene expression patterns, displayed for key genes like SFTA1, TMPRSS4, GABRB2, and others. E The Venn diagram shows the intersection of DEGs between high- vs low-risk groups (DEGs 1) and PTC vs control groups (DEGs 2), with 248 genes common to both sets. F Gene Ontology (GO) enrichment analysis of DEGs shows significant biological processes related to immune cell differentiation, lymphocyte activation, and cell signaling pathways. G Enrichment analysis of top ten signaling pathways associated with DEGs, including cytokine and chemokine receptor binding, T cell receptor signaling, and immune receptor activities
Fig. 4
Fig. 4
Identification of prognostic genes through univariate Cox regression and LASSO analysis. A Forest plot of univariate Cox regression analysis showing the hazard ratios (HR) and P-values for genes associated with the prognosis of PTC. Key genes include CEACAM21, BCAP29, and KLRB1, with statistical significance indicated by p-values. B LASSO coefficient profile plot showing the coefficients of prognostic genes across different values of log(lambda). The vertical dashed line indicates the optimal lambda.min = 0.011, which selects the genes for further analysis. C LASSO cross-validation plot showing the partial likelihood deviance across different values of log(lambda), with the red dots indicating the minimum value of lambda.min = 0.011. D Forest plot of multivariate Cox regression analysis showing the HR for the selected prognostic genes, including KLRB1, TSHZ2, and TRABD2A, with their respective p-values and confidence intervals
Fig. 5
Fig. 5
Risk model evaluation and prognostic prediction. A Cumulative risk score distribution of PTC patients with high and low-risk scores, showing the increasing trend of risk scores across patients. B A Scatter plot displays the distribution of survival status (dead or alive) relative to the increasing risk score, with red indicating deceased patients and green indicating alive patients. C Kaplan–Meier survival curves for the high-risk and low-risk groups show significant differences in survival probability (P = 0.0033 in the top panel and P < 0.0001 in the bottom panel). D ROC curves evaluating the predictive performance of the risk model at 1, 3, and 5 years, with AUC values of 0.71, 0.82, and 0.85, respectively, in the top panel, and AUC values of 0.99, 0.93, and 0.90, respectively, in the bottom panel. E Violin Diagram showing the expression levels of key prognostic genes (TSHZ2, KLRB1, and TRABD2A) in high and low-risk groups, with corresponding clinical types and risk scores
Fig. 6
Fig. 6
ROC analysis of the risk model and key prognostic genes. A ROC curve evaluating the overall performance of the risk model, with an AUC value of 0.95, indicating excellent predictive ability. B ROC curves for the individual prognostic genes KLRB1, TSHZ2, and TRABD2A, with AUC values of 0.65, 0.84, and 0.79, respectively, demonstrating their predictive value for PTC prognosis
Fig. 7
Fig. 7
Distribution of risk scores across clinical characteristics. A Box plot comparing risk scores between patients aged ≤ 65 and > 65, showing significant differences (***P < 0.001). B Box plot comparing risk scores between high-risk and low-risk groups, with significant differences (***P < 0.001). C Box plot comparing risk scores across different stages of PTC (Stage I to IV), with significant differences between Stage I and other stages (*P < 0.05). D Box plot comparing risk scores between female and male patients. E Box plot comparing risk scores across different T stages (T1 to T4). F Box plot comparing risk scores between N0 and N1 stages. G Box plot comparing risk scores between M0 and M1 groups
Fig. 8
Fig. 8
Immune microenvironment and immune checkpoint analysis in high and low-risk groups. A Heatmap showing immune cell infiltration levels across high-risk and low-risk groups, with clusters of immune-related genes based on their expression patterns. B Box plots comparing the abundance of different immune cell types (B lymphocytes, cytotoxic lymphocytes, fibroblasts, NK cells, and T cells) between high-risk and low-risk groups, with significant differences indicated. C Spearman correlation matrix showing the correlation between immune cell infiltration and immune checkpoint-related genes, with statistical significance denoted by asterisks. D Violin plots comparing immunophenoscore (IPS) results for immune checkpoint inhibitors (CTLA4, PD-L1, and PD-1) between high-risk and low-risk groups, showing differential expression patterns. E Spearman correlation analysis between risk scores and the expression of KLRB1, TSHZ2, and TRABD2A across various immune checkpoint inhibitors (CTLA4, PD-L1, and PD-1), with correlation values displayed
Fig. 9
Fig. 9
Gene regulatory relationships between TFs and regulator-associated cells. A Heat map of the relationship between different regulatory molecules (red represents high activity, blue represents low activity) and B scatter plot of the correlation between pTPRGs gene and regulator activity (red fitted line in the figure, showing the trend relationship between the two)

Similar articles

References

    1. Shaerf DA, Roberton JB, Horwitz MD. Traumatic pseudoaneurysm of the ulnar artery treated with ultrasound guided thrombin injection. J Hand Surg (European Vol). 2019;44(6):652–4. - PubMed
    1. McLeod DSA, et al. Contemporary debates in adult papillary thyroid cancer management. Endocr Rev. 2019;40(6):1481–99. - PubMed
    1. Krajewska J, et al. Early diagnosis of low-risk papillary thyroid cancer results rather in overtreatment than a better survival. Front Endocrinol (Lausanne). 2020;11: 571421. - PMC - PubMed
    1. Zhu X, et al. DNMT3B-mediated FAM111B methylation promotes papillary thyroid tumor glycolysis, growth and metastasis. Int J Biol Sci. 2022;18(11):4372–87. - PMC - PubMed
    1. Zhang H, et al. The molecular feature of macrophages in tumor immune microenvironment of glioma patients. Comput Struct Biotechnol J. 2021;19:4603–18. - PMC - PubMed

MeSH terms

Substances