. 2025 Aug 2;9(1):271.
doi: 10.1038/s41698-025-01056-8.

Integrating genomic and pathological characteristics to enhance prognostic precision in advanced NSCLC

Affiliations

Integrating genomic and pathological characteristics to enhance prognostic precision in advanced NSCLC

Yingjie Han et al. NPJ Precis Oncol. .

Abstract

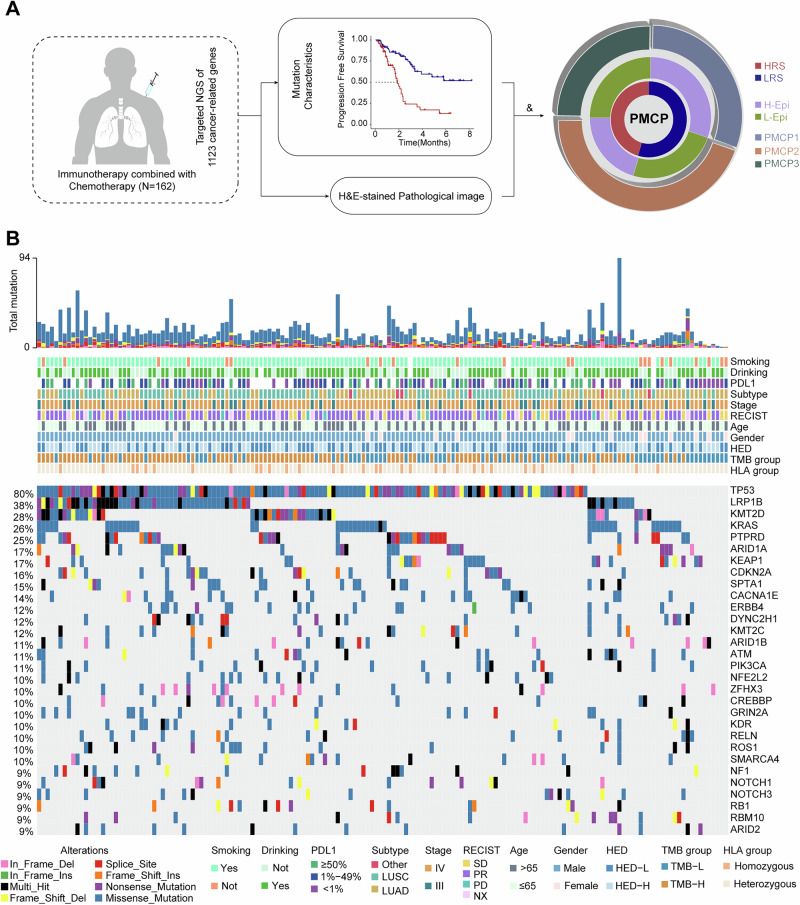
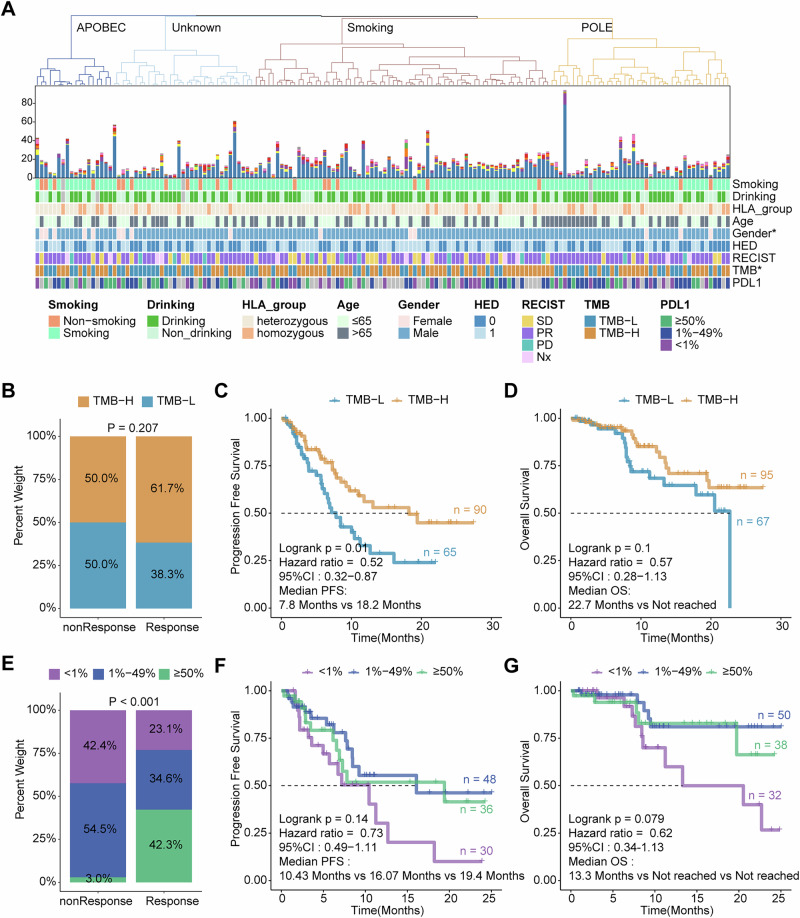
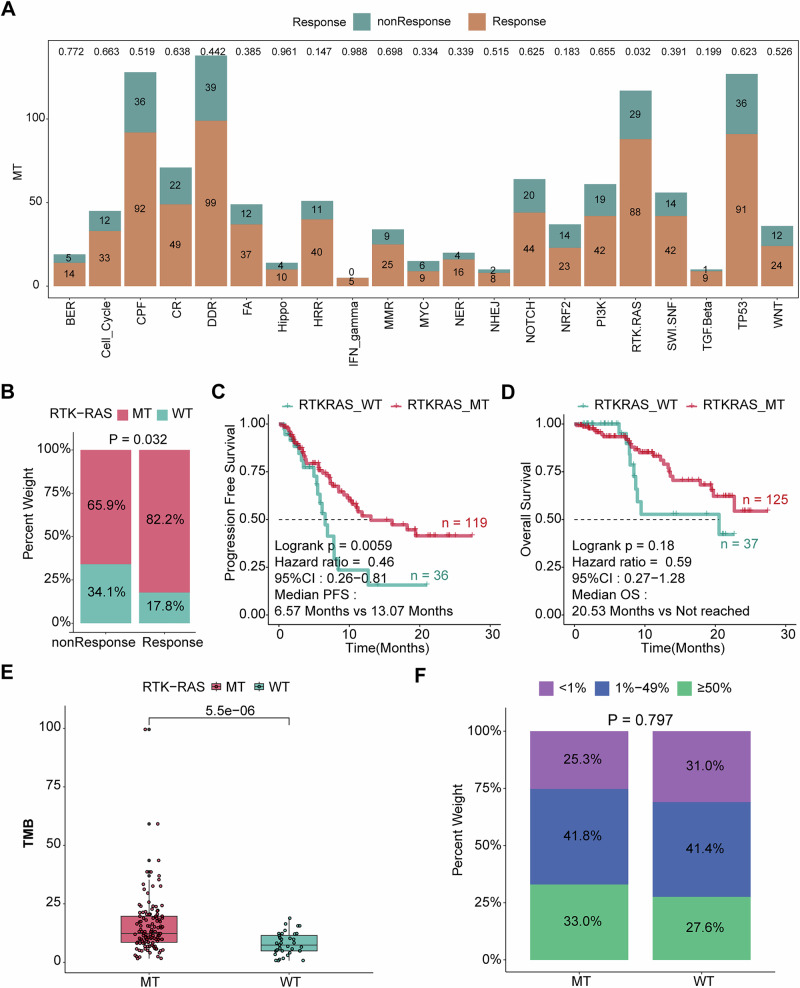
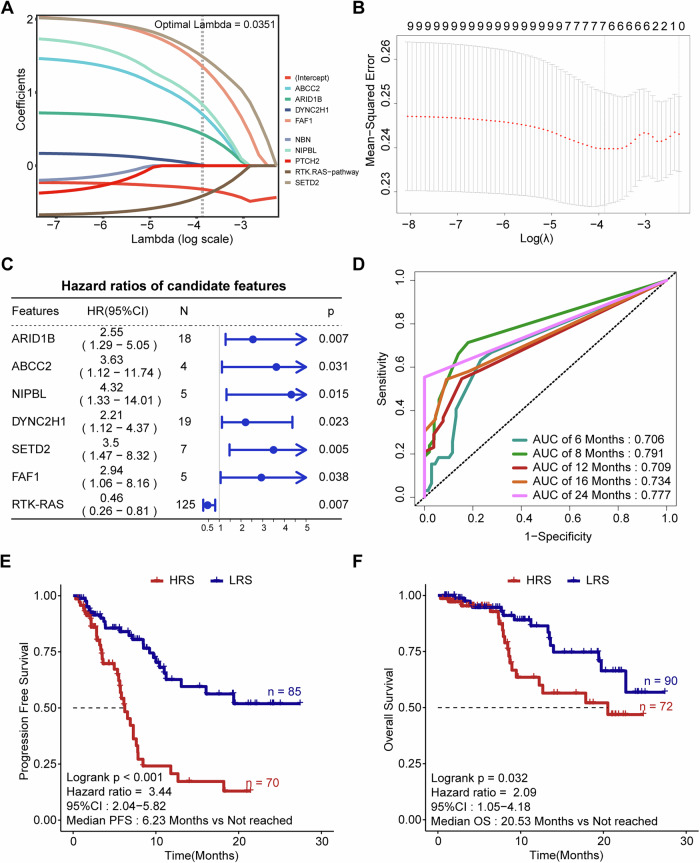
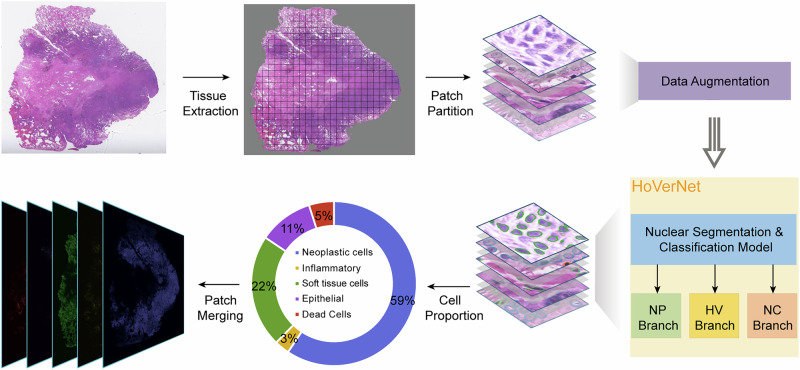
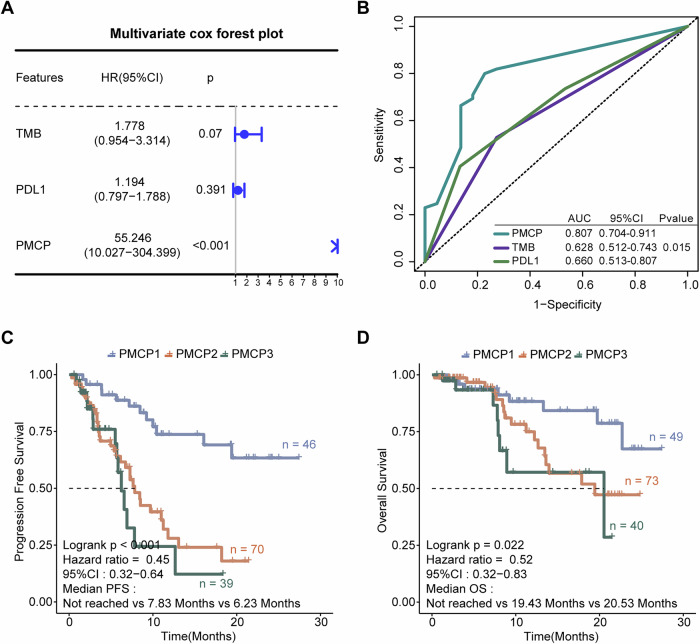
Although immunotherapy combined with chemotherapy (ICT) is the standard treatment for advanced non-small cell lung cancer (NSCLC), identification of reliable prognostic biomarkers remains challenging. In this multicenter study, we performed next-generation sequencing of tumor samples from 162 patients receiving first-line ICT at the Chinese PLA General Hospital and collected their pathological image information. First, we established a model to predict the risk of tumor progression based on genomic characteristics. Furthermore, a deep learning method was employed to recognize different cell types from pathological images, which significantly improved the accuracy of progression-free survival (PFS) and overall survival (OS) prediction. In summary, we constructed a Prognostic Multimodal Classifier for Progression (PMCP) that possesses the capability to precisely forecast PFS and OS. Patients with the PMCP1 subtype exhibit a low risk of progression and demonstrate a higher proportion of epithelial cells. PMCP highlighted the potential value of multimodal biomarkers in guiding clinical decisions regarding ICT. The area under curve (AUC) for predicting PFS was 0.807. This study revealed the importance of integrating genomic and pathological data to improve prognostic accuracy and enable personalized treatment for patients with advanced NSCLC.


Conflict of interest statement

Competing interests: The authors declare the following competing interests: S.Y.L., J.L.Z., Y.Z., J.Y.S. and J.C. are employed by Beijing ChosenMed Clinical Laboratory Co., Ltd. but declare no non-financial competing interests. All other authors declare no financial or non-financial competing interests.

Figures

Fig. 1
Fig. 1. Genomic landscape in 162 advanced NSCLC patients receiving ICT.
A The analysis workflow of the study. B Mutation oncology of 162 NSCLC patients for top 30 genes with alternation frequency. Top histogram: number of mutations per sample; Middle track: clinical information per sample. HRS high-risk, LRS low-risk, H-Epi high proportion of epithelial cells, L-Epi low proportion of epithelial cells, HED HLA class I evolutionary divergence, NE not evaluated, SD stable disease, PR partial response, PD progressive disease, NX unknown.
Fig. 2
Fig. 2. Immunotherapy-related feature analysis in 162 patients with advanced NSCLC receiving ICT.
A Clustering of NSCLC patients based on proportions of mutation signatures. Each cluster group is named according to the dominant mutation signature (APOBEC, unknown, smoking, and POLE). B TMB analysis between the ‘Response’ group and the ‘nonResponse’ group. Kaplan–Meier survival analysis for PFS (C) and OS (D) between the TMB-H group and TMB-L group. E PD-L1 analysis between the ‘Response’ group and the ‘nonResponse’ group. Kaplan–Meier survival analysis for PFS (F) and OS (G) in different PD-L1 groups. *p < 0.05.
Fig. 3
Fig. 3. Therapeutic efficacy differences in pathways.
A The number of samples exhibiting genetic alterations in 21 pathways between the ‘Response’ group and ‘nonResponse’ group. B Comparing the frequency of genetic alterations in the RTK-RAS pathway between the ‘Response’ group and ‘nonResponse’ group. Kaplan–Meier survival analysis for PFS (C) and OS (D) between the RTK-RAS_MT group and RTK-RAS_WT group. The distribution of TMB (E) and PD-L1 (F) between the RTK-RAS_MT group and RTK-RAS_WT group.
Fig. 4
Fig. 4. Construction of the RS prognostic signature for 162 patients in the ICMBS cohort.
A LASSO coefficient profiles of mutation genes and pathways. B Partial likelihood deviance for the LASSO coefficient profiles. C Forest plot depicting the relationship between the prognostic signature and PFS identified through univariate analysis. Data are presented in the form of hazard ratios, with error bars indicating 95% confidence intervals. HR were calculated using Cox proportional hazards regression modeling. D Time-dependent ROC curves and AUC values of the model for predicting survival status in 6-, 8-, 12-, 16-, and 24-months. E PFS improvements for LRS versus HRS. F OS improvements for LRS versus HRS.
Fig. 5
Fig. 5. Cox regression analysis of subtypes in 162 patients in the ICMBS cohort.
Univariate COX regression analysis (A) and multivariate regression analysis (B) for PFS of RS and clinicopathological features. A Hazard ratio > 1 indicates that the feature is a risk factor, and a hazard ratio <1 indicates that the feature is a protective factor. p < 0.05 was considered statistically significant.
Fig. 6
Fig. 6. The analysis workflow of the HoVer-Net.
NP nuclear pixels prediction, HV horizontal and vertical map predictions, NC nuclear type prediction.
Fig. 7
Fig. 7. Integrating genomic alterations and pathological images to construct a prognostic multi-modal classifier to evaluate the prognostic value.
Multivariate Cox regression analysis for PFS (A), time-dependent ROC for predicting PFS (B). Kaplan–Meier curves of PFS (C) and OS (D) for patients within PMCP.

Similar articles

References

    1. Bray, F. et al. Global cancer statistics 2022: GLOBOCAN estimates of incidence and mortality worldwide for 36 cancers in 185 countries. CA Cancer J. Clin.74, 229–263 (2024). - PubMed
    1. Siegel, R. L., Miller, K. D., Wagle, N. S. & Jemal, A. Cancer statistics, 2023. Cancer J. Clin.73, 17–48 (2023). - PubMed
    1. SEER*Explorer: An interactive website for SEER cancer statistics [Internet]. Surveillance Research Program, National Cancer Institute; 2025 Jul 2. [cited 2025 Jul 22]. Available from: https://seer.cancer.gov/statistics-network/explorer/.
    1. Chen, R. et al. Emerging therapeutic agents for advanced non-small cell lung cancer. J. Hematol. Oncol.13, 58 (2020). - PMC - PubMed
    1. Davodabadi, F. et al. Cancer chemotherapy resistance: mechanisms and recent breakthrough in targeted drug delivery. Eur. J. Pharmacol.958, 176013 (2023). - PubMed

LinkOut - more resources