. 2025 Aug 2;16(1):419.
doi: 10.1186/s13287-025-04328-z.

hUC-MSCs and derived exosomes attenuate DEX-induced muscle atrophy through modulation of estrogen signaling pathway

Affiliations

hUC-MSCs and derived exosomes attenuate DEX-induced muscle atrophy through modulation of estrogen signaling pathway

Na Li et al. Stem Cell Res Ther. .

Abstract

Background: Sarcopenia, a multifactorial syndrome characterized by progressive loss of skeletal muscle mass and strength, combined with impaired physical function, is associated primarily with aging but also driven by chronic inflammation, immobility, and endocrine dysregulation. It leads to increased risks of frailty, falls, and loss of independence, posing a major public health challenge for aging populations. Although human umbilical cord-derived mesenchymal stem cells (hUC-MSCs) and their derived exosomes (MSC-Exos) have demonstrated remarkable potential in regenerative medicine, their safety and efficacy in treating sarcopenia remain unclear. To address this issue, we conducted a preclinical study to systematically evaluate their therapeutic potential and safety.

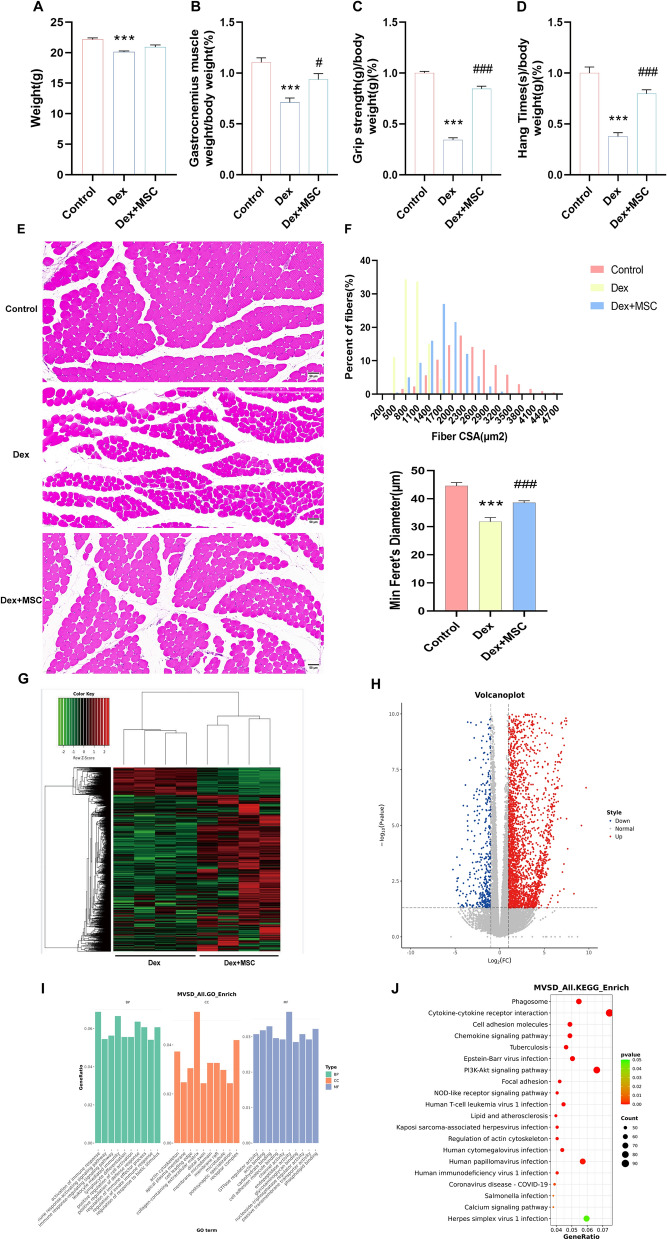
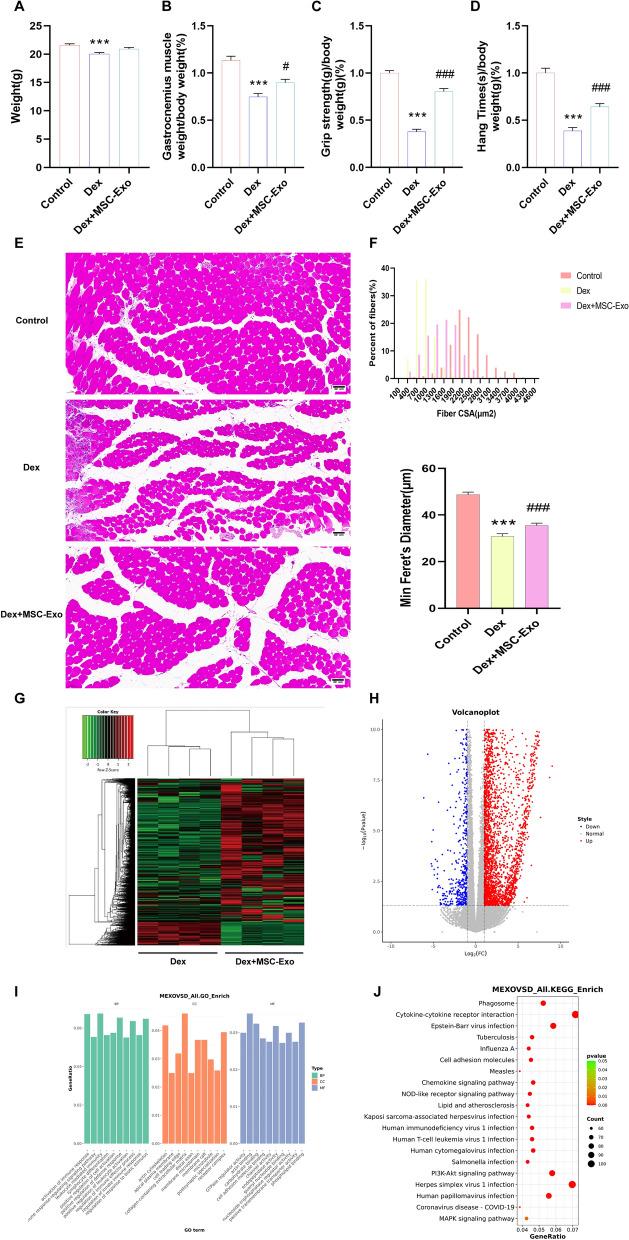
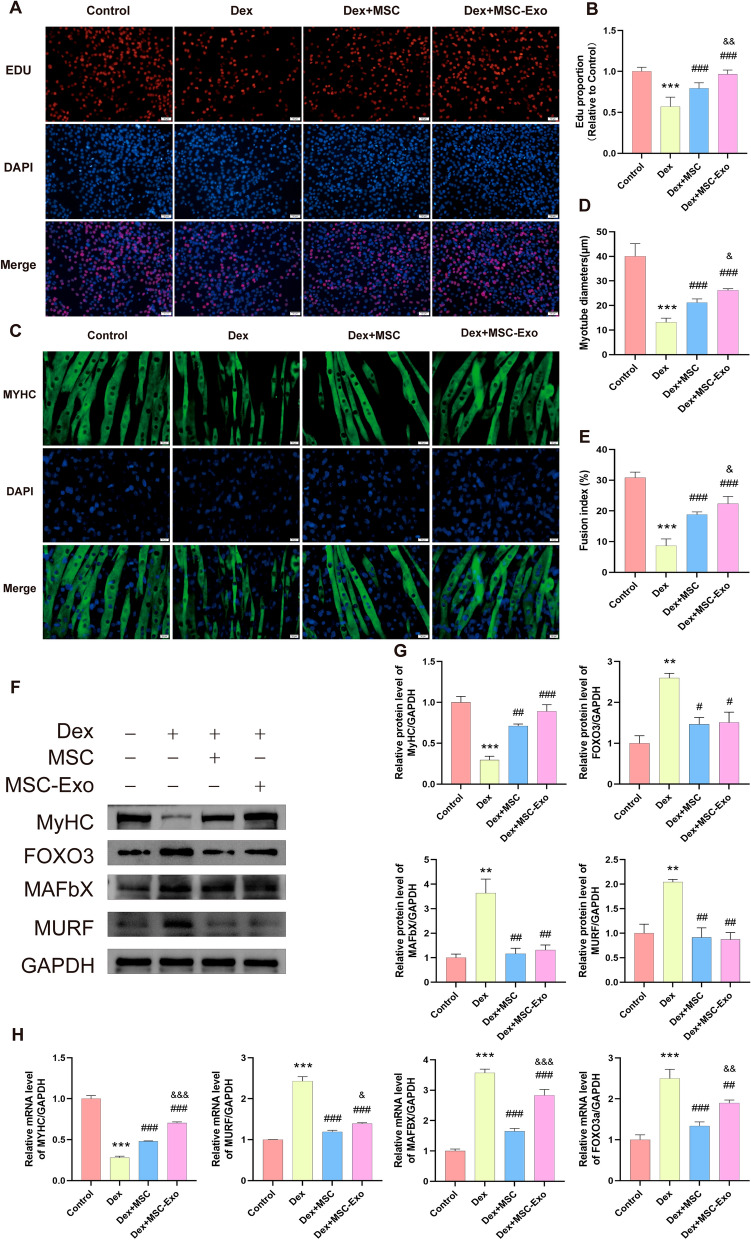
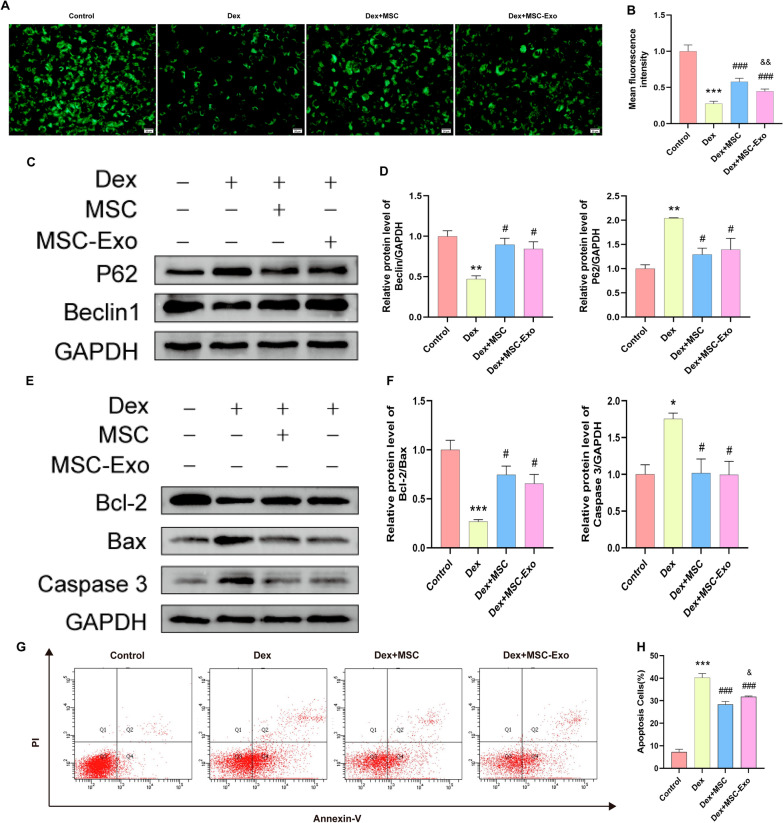
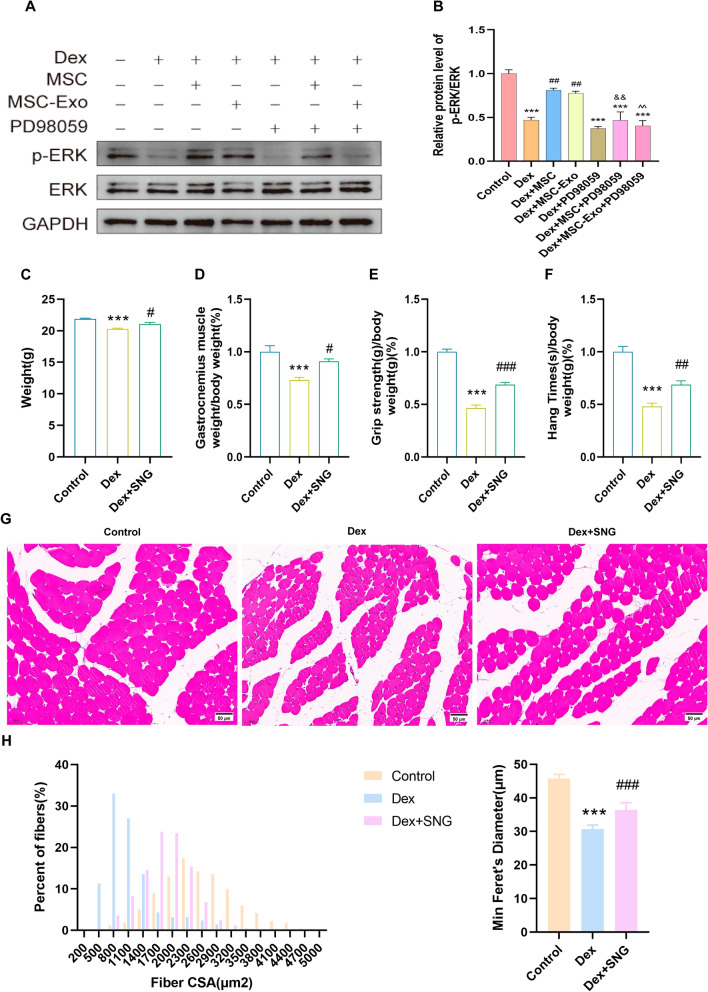
Methods: Male C57BL/6 J mice were treated with dexamethasone (20 mg/kg, i.p.) to induce muscle atrophy. Subsequently, bilateral intramuscular injection of hUC-MSCs (1 × 10⁶ cells/kg), exosomes (100 μg), or intraperitoneal injected of SNG162 (40 mg/kg) for two weeks. Gastrocnemius muscles were excised for histological analysis, TUNEL staining, Western blotting, RNA sequencing, and qPCR. Differentiated C2C12 myotubes were treated with 10 μM dexamethasone and co-cultured with hUC-MSCs or exosomes for 24 h. Samples were collected for qPCR, Western blot analyses and flow cytometry. EdU labeling was used to assess cell proliferation, MyHC and MDC immunofluorescence staining were employed to assess myotube morphology and autophagy levels, respectively. ELISA was used to quantify inflammatory cytokines and estrogen levels.

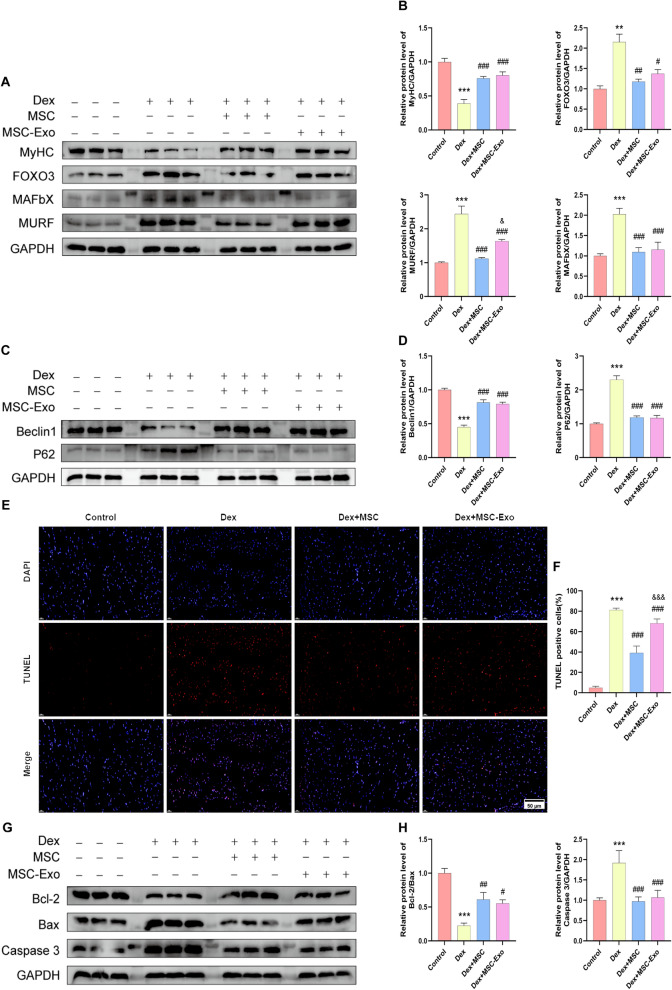
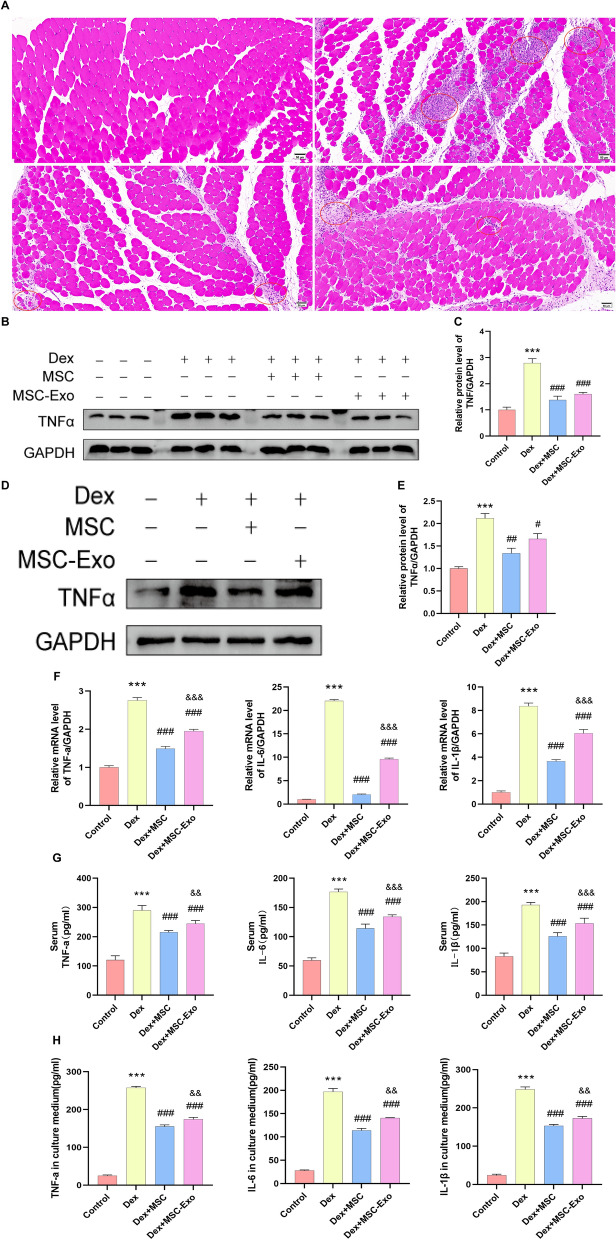
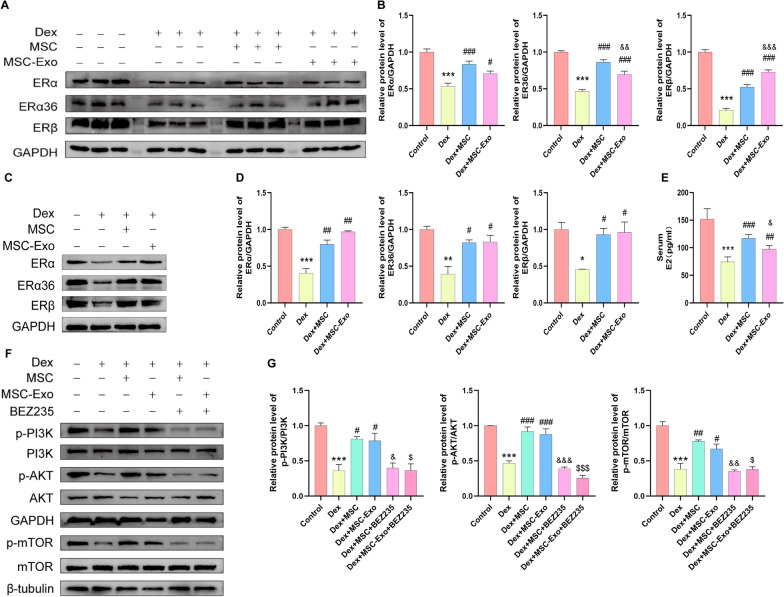
Results: hUC-MSCs, MSC-Exos and SNG162 improved grip strength and endurance in mice, increased the Gast muscle-to-body weight ratio without adversely affecting overall body weight, and enhanced muscle fiber cross-sectional area (CSA). Concurrently, they upregulated the expression of MyHC, Beclin-1, Bcl-2/Bax, ERα46, ERα36, ERβ and estradiol, while reducing key atrophy and inflammatory markers, including FOXO3, MAFbX, MURF1, TNF-α, IL-6, IL-1β, P62, and Caspase-3 in vitro and in vivo models. Furthermore, hUC-MSCs and MSC-Exos attenuated DEX-induced apoptosis in Gast muscles and C2C12 myotubes. Notably, MSC-Exos outperformed hUC-MSCs in promoting the proliferation and differentiation of C2C12 myotubes. Mechanistically, RNA sequencing and Western blot analysis identified the PI3K/AKT/mTOR and ERK1/2 signaling pathways as pivotal mediators of these effects.

Conclusions: This study underscores the potential of hUC-MSCs and their derived exosomes as a novel, safe, and effective therapeutic strategies for sarcopenia, offering promising avenues for clinical application.

Keywords: Apoptosis; Autophagy; Dexamethasone; Exosome; Human umbilical cord-derived mesenchymal stem cells; Muscle atrophy; Sarcopenia.


Conflict of interest statement

Declarations. Ethical approval and consent to participate: This study was performed at the Stem Cell Clinical Research Center of the First Affiliated Hospital of Dalian Medical University. This study was approved by the Ethics Committee of the First Affiliated Hospital of Dalian Medical University (Project Title: Research on the Treatment of Sarcopenia Using Human Umbilical Cord Mesenchymal Stem Cells Combined with Phytomedicine; Approval No. YJ-GZR-SQ-2024–69; Approved on March 5, 2024). The ethical approval covered the collection of umbilical cord specimens, which were obtained from healthy fetuses delivered by cesarean section. Informed consent was provided by all pregnant women participants and their family members prior to specimen collection. All animal experiments were performed in strict accordance with the ethical guidelines established by the Animal Research Ethics Committee of Dalian Medical University (Project Title: Research on the Treatment of Sarcopenia with Human Umbilical Cord Mesenchymal Stem Cells Combined with Epimedium; Approval No. AEE24221; Approved on January 9, 2024). Consent for publication: All authors reviewed and endorsed the final version of the manuscript for submission and publication. Artificial intelligence (AI): The authors declare that no AI-generated content was used in this manuscript. Competing interests: The authors declare that they have no competing interests.

Figures

Fig. 1
Fig. 1
hUC-MSCs protect mice against DEX-induced muscle atrophy. A Final body weight of mice at the conclusion of the study (n = 6); B Gast muscle weight in body weight at the end of the experiment (n = 6); C Standardized grip strength (N/g) at the end of the experiment (n = 6); D Standardized endurance time (s/g) at the end of the experiment (n = 6); E HE-stained sections of skeletal muscle tissue from each group of mice (n = 6) Scale bar: 50 μm; F Percent of fibers (%) and Min feret’s Diameter. G Heatmap of DEGs in different samples. H The volcano map of DEGs in different samples. I Top enriched gene ontology terms: biological process (BP), cellular component (CC), and molecular function (MF) for DEGs. J Top 10 KEGG enrichment analysis of DEGs in different samples. DEX group: n = 4. MSC group: n = 4. Data from three independent experiments are reported as the mean ± SEM. ***P < 0.001 vs. Control. # P < 0.05, ## P < 0.01, ### P < 0.001 vs. DEX
Fig. 2
Fig. 2
MSC-Exos protected mice against DEX-induced muscle atrophy. A Final body weight of mice at the conclusion of the study (n = 6); B Gast muscle weight in body weight at the end of the experiment (n = 6); C Grip strength of mice at the end of the experiment (n = 6); D Endurance test of mice at the end of the experiment (n = 6); E HE-stained sections of skeletal muscle tissue from each group of mice (n = 6) Scale bar: 50 μm; F Percent of fibers (%) and min feret’s diameter; G The volcano map of DEGs in DEX and MSC-Exos groups; H Heatmap of DEGs in DEX and MSC-Exos groups; I. Top enriched gene ontology terms: biological process (BP), cellular component (CC), and molecular function (MF) for DEGs; J Top 10 KEGG enrichment analysis of DEGs in DEX and MSC-Exos groups. DEX group: n = 4. MSC-Exos group: n = 4. *** P < 0.001 vs. Control. # P < 0.05, ## P < 0.01, ### P < 0.001 vs. DEX
Fig. 3
Fig. 3
hUC-MSCs and MSC-Exos alleviate protein degradation, autophagy and apoptosis in DEX-induced skeletal muscle atrophy. A Representative immunoblot analyses of MyHC, FOXO3, MAFbX, MURF, and GAPDH were performed in GA tissue, with the data illustrating protein expression levels. GAPDH served as the normalization reference for protein loading. B Quantitative analysis of MyHC、FOXO3, MAFbX, MURF expression levels among the groups. C Representative Western blot images of Beclin 1, P62 and GAPDH were analyzed in GA. D Quantitative analysis of Beclin 1, P62 expression levels among the groups. The data from three separate experiments are expressed as the mean ± SEM. E Apoptosis in muscle tissue was evaluated through TUNEL staining (red), with nuclei visualized using DAPI counterstaining (blue). Scale bar: 50 μm. F Apoptosis percentage in Gast in each group. G Representative immunoblot data for Bcl-2, Bax, Caspase-3, and GAPDH were examined in GA, with GAPDH serving as the reference protein for loading normalization. H Quantitative analysis of Bcl-2/Bax, Caspase 3 expression levels among the groups. *** P < 0.001 vs. Control. # P < 0.05, ## P < 0.01, ### P < 0.001 vs. DEX. & P < 0.05, &&& P < 0.001 vs. MSC. The complete, uncropped versions of the full-length gels and blots are provided in the supplementary materials
Fig. 4
Fig. 4
hUC-MSCs and MSC-Exos alleviate DEX-induced inflammation both in vivo and in vitro. A HE-stained sections of skeletal muscle tissue from each group of mice, with red circles indicating the locations of inflammatory cell infiltration; scale bar: 50 μm; n = 6. B Immunoblot analysis of TNF-α and GAPDH was conducted in GA, with representative results presented. C Quantitative analysis of TNF-α expression levels among the groups. D Representative immunoblot results of TNF-α and GAPDH were examined in C2C12 myotubes, with GAPDH serving as the internal loading reference. E Quantitative analysis of TNF-α expression levels among the groups. F Relative mRNA levels of TNF-α, IL-6, IL-1β mRNA in skeletal muscle was quantified relative to GAPDH, which was used as the internal control for normalization. F and H. Expression levels of the cytokines TNF-α, IL-6 and IL-1β in C2C12 cell serum and supernatants were detected by ELISA. All experiments were performed at least three times. *** P < 0.001 vs. Control. # P < 0.05, ### P < 0.001 vs. DEX. && P < 0.01, &&& P < 0.001 vs. MSC
Fig. 5
Fig. 5
hUC-MSCs and MSC-Exos promote the C2C12 myotube proliferation and differentiation A and B Representative visuals from the EdU assay for cell proliferation are provided, with a scale bar indicating 50 μm. C Representative immunofluorescence staining visuals for MyHC are presented. Scale bar: 20 μm. D Quantitative analysis of Myotube diameters. E Quantitative analysis of Fusion index. The cells were incubated with EDU or antibody against MyHC for 24 h. F Representative immunoblot results for MyHC, FOXO3, MAFbX, MURF, and GAPDH in C2C12 myotubes are shown. G Quantitative analysis of MyHC, FOXO3, MAFbX, MURF expression levels among the groups. H. Relative mRNA levels of MyHC, FOXO3, MAFbX, MURF. ** P < 0.01, *** P < 0.001 vs. Control. # P < 0.05, ## P < 0.01, ### P < 0.001 vs. DEX. & P < 0.05, && P < 0.01, &&& P < 0.001 vs MSC
Fig. 6
Fig. 6
hUC-MSCs and MSC-Exos regulate C2C12 myotube atrophy and apoptosis in DEX-treated C2C12 myotubes. A and B Representative immunofluorescence staining images of MDC are displayed. The scale bar represents 20 μM. C Representative immunoblot analyses of P62, Beclin 1, and GAPDH in C2C12 myotubes are provided. D Quantitative analysis of Beclin 1 and P62 expression levels among the groups. E Representative immunoblot results for Bcl-2, Bax, Caspase-3, and GAPDH in C2C12 myotubes are shown. F Quantitative analysis of Bcl-2/Bax and Caspase 3/GAPDH expression levels among the groups. G Apoptotic effect of DEX on C2C12 Myotubes. H The proportion of apoptotic cells was evaluated using flow cytometry with dual staining of FITC and PI. * P < 0.05. ** P < 0.01, *** P < 0.001 vs. Control. # P < 0.05, ###P < 0.001 vs. DEX. & P < 0.05, && P < 0.01 vs. MSC
Fig. 7
Fig. 7
hUC-MSCs and MSC-Exos modulate estrogen receptors and PI3K/AKT/mTOR signaling in DEX-treated muscle and C2C12 myotubes: A and C The expression levels of ERα, ERα36, and ERβ proteins were assessed via Western blotting. B and D Quantitative analysis of ERα, ERα36, and ERβ expression levels among the groups. E Expression levels of the E2 in serum were detected by ELISA. F The protein expressions of p-PI3K, PI3K, p-AKT, AKT, p-mTOR and mTOR. GAPDH was used as the loading control. G p-PI3K/PI3K, p-AKT/AKT and p-mTOR/mTOR expression levels among the groups. * P < 0.05, ** P < 0.01, *** P < 0.001 vs. Control. # P < 0.05, ## P < 0.01, ### P < 0.001 vs. DEX. & P < 0.05, && P < 0.01, &&& P < 0.001 vs. MSC. $ P < 0.05, $$$ P < 0.05 vs. MSC-Exos
Fig. 8
Fig. 8
Effects of hUC-MSCs and MSC-Exos on PI3K/AKT/mTOR AND ERK1/2 pathways in DEX-induced myotube atrophy. A p-ERK and ERK protein expression levels in DEX-treated C2C12 myotubes following administration of ERK1/2 inhibitors. B Quantitative analysis of p-ERK/ERK expression levels among the groups. C Final body weight of mice at the conclusion of the study (n = 6); D Gast muscle weight in body weight at the end of the experiment (n = 6); E Grip strength of mice at the end of the experiment (n = 6); F Endurance test of mice at the end of the experiment (n = 6); G HE-stained sections of skeletal muscle tissue from each group of mice (n = 6), Scale bar: 50 μm; H. Percent of fibers (%) and Min feret’s Diameter. These results are presented as mean ± SEM of three independent experiments: *** P < 0.001 vs. Control. # P < 0.05, ## P < 0.01, ### P < 0.001 vs. DEX. && P < 0.01 vs. MSC. ^^ P < 0.01 vs. MSC-Exos

References

    1. Gustafsson T, Ulfhake B. Aging skeletal muscles: what are the mechanisms of age-related loss of strength and muscle mass, and can we impede its development and progression? Int J Mol Sci. 2024;25:10932. - PMC - PubMed
    1. Grima-Terrén M, Campanario S, Ramírez-Pardo I, Cisneros A, Hong X, Perdiguero E, et al. Muscle aging and sarcopenia: the pathology, etiology, and most promising therapeutic targets. Mol Aspects Med. 2024;100: 101319. - PubMed
    1. Petermann-Rocha F, Balntzi V, Gray SR, Lara J, Ho FK, Pell JP, et al. Global prevalence of sarcopenia and severe sarcopenia: a systematic review and meta-analysis. J Cachexia Sarcopenia Muscle. 2022;13:86–99. - PMC - PubMed
    1. Sayer AA, Cooper R, Arai H, Cawthon PM, Ntsama Essomba M-J, Fielding RA, et al. Sarcopenia. Nat Rev Dis Primers. 2024;10:68. - PubMed
    1. Sáez de Asteasu ML, Martínez-Velilla N, Zambom-Ferraresi F, García-Alonso Y, Galbete A, Ramírez-Vélez R, et al. Short-term multicomponent exercise impact on muscle function and structure in hospitalized older at risk of acute sarcopenia. J Cachexia Sarcopenia Muscle. 2024;15:2586–94. - PMC - PubMed

MeSH terms

LinkOut - more resources