Randomized Controlled Trial
. 2025 Oct 3;80(10):2752-2758.
doi: 10.1093/jac/dkaf294.

Clinical course of patients with bloodstream infections enrolled in the BALANCE clinical trial

Collaborators, Affiliations
Randomized Controlled Trial

Clinical course of patients with bloodstream infections enrolled in the BALANCE clinical trial

Sean W X Ong et al. J Antimicrob Chemother. .

Abstract

Objectives: There is a lack of data describing the longitudinal clinical trajectories of vital signs and laboratory tests in patients with bloodstream infection (BSI). The BALANCE trial, which randomly assigned patients with BSI to receive 7 or 14 days of antibiotic treatment, provided rich daily data to describe these trajectories.

Methods: As part of the BALANCE trial, we collected several daily parameters (temperature, heart rate, mean arterial pressure, systolic blood pressure, respiratory rate, WBC count, C-reactive protein, platelet count and SOFA score) until Day 14 of illness, discharge or death. In this post hoc descriptive sub-study, we described trajectories of these parameters, stratified by treatment group allocation and by the primary outcome of 90-day all-cause mortality.

Results: Among 3608 patients included, median age was 70 years and 46.7% were female. At enrolment, 55.0% were admitted in the ICU and 21.2% required mechanical ventilation. Longitudinal trajectories of vital signs, laboratory tests and SOFA scores were almost identical comparing the two treatment groups, including from Day 7 after treatment divergence. These trajectories were markedly different when comparing survivors (3034 patients; 84.7%) and non-survivors (547 patients; 15.3%), with non-survivors demonstrating a slower recovery course throughout the 14-day period.

Conclusions: Among hospitalized patients with BSI, recovery trajectories were similar in patients assigned to 7- versus 14-day antibiotic treatment durations but were different comparing survivors versus non-survivors. These data could be used to inform daily clinical management, formulate predictive risk scores or clinical decision rules, and guide future research into individualized therapeutic strategies.


Figures

Figure 1.
Figure 1.
Patient status of the entire study cohort on each day of illness. This alluvial chart depicts the flow of patients in the study based on their status on each day of illness. Days of illness were counted in reference to the date of the index positive blood culture collection (Day 0). Stacked bar charts depict the number of patients who died (dark red), were in the ICU (orange), on the ward (green), or were discharged alive (blue). Flows between each bar show the number of patients moving between each state (e.g. from ward to ICU, ICU to ward, ward to discharge, etc.).
Figure 2.
Figure 2.
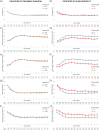
Mean WBC, platelet and CRP values by each day of illness, stratified by treatment allocation group and outcome status. Points depict mean values for each day of illness for each subgroup, while error bars depict CIs around the mean. Panels on the left [(a), (c) and (e)] show the subgroup stratified by treatment allocation group and panels on the right [(b), (d) and (f)] show the cohort stratified by primary outcome (90-day mortality). Corresponding numbers below each graph show the number of patients with available observations per subgroup for each day (e.g. on Day 14 there were 427 patients in the 7-day arm and 471 patients in the 14-day arm who had available WBC values). Days of illness were counted in reference to the date of the index positive blood culture collection (Day 0).
Figure 3.
Figure 3.
Mean values of five vital signs by each day of illness, stratified by treatment allocation group and outcome status. Points depict mean values for each day of illness for each subgroup, while error bars depict CIs around the mean. Panels on the left [(a), (c), (e), (g) and (i)] show the subgroup stratified by treatment allocation group and panels on the right [(b), (d), (f), (h) and (j)] show the cohort stratified by primary outcome (90-day mortality). Corresponding numbers below each graph show the number of patients with available observations per subgroup for each day (e.g. on Day 14 there were 623 patients in the 7-day arm and 681 patients in the 14-day arm who had available temperature readings). Days of illness were counted in reference to the date of the index positive blood culture collection (Day 0).

References

    1. Goto M, Al-Hasan MN. Overall burden of bloodstream infection and nosocomial bloodstream infection in North America and Europe. Clin Microbiol Infect 2013; 19: 501–9. 10.1111/1469-0691.12195 - DOI - PubMed
    1. Jang YR, Eom JS, Chung W et al. Prolonged fever is not a reason to change antibiotics among patients with uncomplicated community-acquired acute pyelonephritis. Medicine (Baltimore) 2019; 98: e17720. 10.1097/MD.0000000000017720 - DOI - PMC - PubMed
    1. Behr MA, Drummond R, Libman MD et al. Fever duration in hospitalized acute pyelonephritis patients. Am J Med 1996; 101: 277–80. 10.1016/S0002-9343(96)00173-8 - DOI - PubMed
    1. Circiumaru B, Baldock G, Cohen J. A prospective study of fever in the intensive care unit. Intensive Care Med 1999; 25: 668–73. 10.1007/s001340050928 - DOI - PubMed
    1. Povoa P, Garvik OS, Vinholt PJ et al. C-reactive protein and albumin kinetics after antibiotic therapy in community-acquired bloodstream infection. Int J Infect Dis 2020; 95: 50–8. 10.1016/j.ijid.2020.03.063 - DOI - PubMed

Publication types

Substances