. 2025 Aug 13;25(32):12158-12165.
doi: 10.1021/acs.nanolett.5c02232. Epub 2025 Aug 3.

Multiparametric Characterization of Individual Suspended Nanoparticles Using Confocal Fluorescence and Interferometric Scattering Microscopy with Microfluidic Confinement

Affiliations

Multiparametric Characterization of Individual Suspended Nanoparticles Using Confocal Fluorescence and Interferometric Scattering Microscopy with Microfluidic Confinement

Eric Boateng et al. Nano Lett. .

Abstract

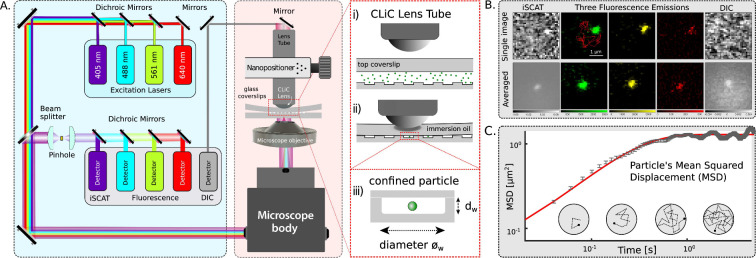
Detailed characterization of the size, mass, payload, and structure of suspended mRNA-lipid nanoparticles (LNPs) is necessary to improve our understanding of how these heterogeneous properties influence therapeutic efficacy and potency. Methods currently in use face limitations in reporting ensemble-average particle properties or requiring dedicated home-built microscopes that are beyond the reach of nanoparticle developers. In this work, we overcome these limitations by combining a commercially available confocal microscope and a convex lens-induced confinement (CLiC) instrument to achieve simultaneous characterization and correlation of the size, mass, refractive index, and nucleic acid payload of individual LNPs. We established the accuracy and precision of our method using nanosized beads and used it to investigate the size, payload, and water content of LNPs in different solvent pH. By employing readily available microscopy tools, we open the door to widespread adoption of our quantitative, in-solution nanoparticle characterization method.

Keywords: confocal microscopy; convex-lens induced confinement; fluorescence; interferometric scattering; lipid nanoparticles; payload; size.


Figures

1
1
Overview of confocal CLiC-MC-iSCAT imaging. (A) Schematic of the confocal microscope equipped with four excitation lasers and five detectors, where the CLiC instrument is placed on top of the microscope stage. The 405 nm laser is used for iSCAT imaging, and the other three wavelengths (488, 561, and 640 nm) are used for fluorescence imaging. Any of the lasers could be used for simultaneous differential interference contrast (DIC) transmission imaging. The CLiC lens tube is controlled by piezo actuators which push the CLiC lens down onto the top coverslip, deforming it until it makes contact with the bottom coverslip containing an embedded array of microwells. Each microwell has a 3 μm width and 500 nm depth. The concentration is sufficiently dilute so that most wells contain either zero or one particle. After the imaging is performed, the top coverslip is raised which creates the opportunity to repopulate the wells and repeat the measurement process, thus increasing measurement statistics. (B) Simultaneous fluorescence and label-free imaging where each particle is detected in at least one fluorescence channel in addition to iSCAT and DIC channels. Particle tracking is performed using one selected fluorescence channel, and for each particle detection, a centered region of interest image is extracted and saved from all channels for further image processing (shown here for a 100 nm polystyrene bead). The absolute values of the per-particle regions of interests are then averaged across detections to improve the image SNR during colocalization and signal quantification. (C) Single-particle trajectories are converted to a mean-squared displacement curve from which the single-particle diffusivity and hydrodynamic diameter are quantified using confined diffusion theory (, Section S1.9).
2
2
Quantitative validation of CLiC-MC-iSCAT imaging using dielectric nanoparticles. (A) Illustration of the simultaneous CLiC-MC-iSCAT imaging of nanoparticles in both fluorescence and label-free: (i) Fluorescence emission of 100 nm polystyrene beads; (ii) iSCAT image of single-bead particles confined in 3 μm diameter microwells (background subtraction using a Gaussian convolution of the recorded iSCAT image was here performed to highlight the particles and edges of the wells (Section S1.7.1)); (iii) DIC image in forward transmission mode; (iv) overlay image using both fluorescence and iSCAT channels showing colocalized particles confined in the wells; (v) nanoparticle traces of individual confined particle to estimate single particle size via the diffusivity-size relation. Scale bar is 5 μm. (B) Measured scaling relationship between the hydrodynamic diameter and the cube root of the iSCAT signal for a suite of nanosized polystyrene beads agrees well with predictions from Mie theory (black dashed line), which describes the scattering of light by spherical particles (Supporting Information, Section S1.8). Different iSCAT signals were obtained for polystyrene and silica particles of the same size, which is consistent with the refractive index difference between silica and polystyrene. The inset is the estimated refractive index histogram for silica particles, where the estimated median refractive index is 1.44 (vertical dashed black line from the inset image). The contour levels in the plot correspond to 17, 33, 50, 67, and 83% of the obtained distribution density. Each sample was measured separately. The number of particles in each distribution that is colocalized with iSCAT ranges from 300 particles for the 50 nm polystyrene to 1100 particles for the 100 nm polystyrene. (C–E) Multiparametric characterization of 100 nm diameter PMMA particles in a single measurement including the following: (C) fluorescence and cube root of the iSCAT scattering intensities as a function of hydrodynamic diameter, where both signals increase as a function of size (black and blue dashed lines are Mie calculations for the refractive indices 1.60 and 1.45, respectively, to enable comparison with the results in panel B), and the inset shows the estimated refractive index distribution of the measured particles, for which the median refractive index is 1.47 (black dashed line); (D) cube root of the iSCAT signal plotted as a function of the cube root of the fluorescence signal, revealing a proportional relationship (correlation is expected, as both signals, to a first approximation, scale with particle volume); (E) cube root of the iSCAT signal plotted as a function of the cube root of the DIC signal, demonstrating a proportional relationship when both signals are detectable in respective imaging channels. Notably, for particles with lowest iSCAT signal, corresponding DIC signal falls below detection and cannot be estimated.
3
3
CLiC-confocal iSCAT and MC fluorescence characterization of mRNA–lipid nanoparticles. CLiC-MC-iSCAT measurements of LNPs containing MC3, DSPC, cholesterol, PEG-DMG, and DiO, at a molar ratio of 50/10/38.5/1.5/1.0, with a N/P ratio of 6 for the mRNA. (A) Scatter-plot of the cube root of the Cy5 mRNA-DiO lipid signal, used to identify particles with and without Cy5 cargo. (B) Size–cube root of the iSCAT signal contour plot of the mRNA–LNPs, where the LNPs colocalized with Cy5-mRNA cargo are in red, whereas those without Cy5-mRNA signal are in black. The contour levels correspond to 17, 33, 50, 67, and 83% of the obtained distribution density. The inset is the refractive index histogram of the LNPs, where the median refractive index of 1.43 indicates a water content around 50% inside the LNPs (gray dashed line). The solid red and black lines in the inset correspond to the refractive index distribution of LNPs colocalized with and without mRNA.
4
4
Multiparametric characterization of suspended LNPs at different pH, containing DNA cargo which is labeled with both pH-sensitive and pH-insensitive dyes. CLiC-MC-iSCAT measurements of LNPs containing MC3, DSPC, cholesterol, and PEG-DMG at a molar ratio of 50/10/39/1.0, with a N/P ratio of 3 for the DNA cargo. (A) Measurements of LNPs at neutral pH in a PBS buffer. The cube root of both the iSCAT signal and fluorescence FAM/Alexa647 ratio as a function of size, where almost all detected LNPs (96%) had a colocalized FAM signal. The contour levels correspond to 17, 33, 50, 67, and 83% of the obtained distribution density. The inset is a histogram of the single-particle refractive index, where the median refractive index of the LNPs is 1.42 (black dashed line), which is similar to that of the mRNA LNPs. (B) Measurements of LNPs at reduced pH in an acetate buffer. Cube root of both the iSCAT signal and fluorescence FAM/Alexa647 ratio as a function of size. We note that the estimated hydrodynamic diameter is noticeably larger than that for neutral pH, and the fluorescence ratio is reduced such that only 43.6% of all LNPs are colocalized with a FAM signal. The inset is a histogram of the single particle refractive index, where the median refractive index of the LNPs is 1.38 (black dashed line).

Similar articles

References

    1. Modena M. M., Rühle B., Burg T. P., Wuttke S.. Nanoparticle characterization: what to measure? Adv. Mater. 2019;31(32):1901556. doi: 10.1002/adma.201901556. - DOI - PubMed
    1. Mahmoudi M.. The need for robust characterization of nanomaterials for nanomedicine applications. Nat. Commun. 2021;12(1):5246. doi: 10.1038/s41467-021-25584-6. - DOI - PMC - PubMed
    1. Zhu S., Ma L., Wang S., Chen C., Zhang W., Yang L., Hang W., Nolan J. P., Wu L., Yan X.. Light-scattering detection below the level of single fluorescent molecules for high-resolution characterization of functional nanoparticles. ACS Nano. 2014;8(10):10998–11006. doi: 10.1021/nn505162u. - DOI - PMC - PubMed
    1. Priest L., Peters J. S., Kukura P.. Scattering-based Light Microscopy: From Metal Nanoparticles to Single Proteins. Chem. Rev. 2021;121(19):11937–11970. doi: 10.1021/acs.chemrev.1c00271. - DOI - PMC - PubMed
    1. Kashkanova A. D., Blessing M., Gemeinhardt A., Soulat D., Sandoghdar V.. Precision size and refractive index analysis of weakly scattering nanoparticles in polydispersions. Nat. Methods. 2022;19(5):586–593. doi: 10.1038/s41592-022-01460-z. - DOI - PMC - PubMed

LinkOut - more resources