. 2025 Sep;12(33):e03109.
doi: 10.1002/advs.202503109. Epub 2025 Aug 4.

The Role of HINT3 in Myocardial Ischemia-Reperfusion Injury in Male Mice: Mechanisms Involving SDHA and its Acetylation

Affiliations

The Role of HINT3 in Myocardial Ischemia-Reperfusion Injury in Male Mice: Mechanisms Involving SDHA and its Acetylation

Jiabin Yu et al. Adv Sci (Weinh). 2025 Sep.

Abstract

Myocardial ischemia-reperfusion (I/R) injury is characterized by oxidative stress, mitochondrial dysfunction, and cardiomyocyte apoptosis. During I/R, the accumulation and oxidation of succinate contribute to reactive oxygen species (ROS) production, worsening tissue damage. Histidine triad nucleotide-binding protein 3 (HINT3) is identified as a regulator of mitochondrial function and cardiomyocyte survival during I/R. In a mouse I/R model and an oxygen-glucose deprivation/reoxygenation (OGD/R) model, it shows that HINT3 expression is downregulated after I/R. Cardiomyocyte-specific knockout of HINT3 exacerbates myocardial injury, impairs cardiac function, and promotes mitochondrial dysfunction and apoptosis, whereas HINT3 overexpression mitigates these effects. Mechanistically, HINT3 interacts with succinate dehydrogenase subunit A (SDHA), suppresses HDAC1 expression, and prevents SDHA deacetylation at K335, reducing SDH activity and mitochondrial ROS production. These findings highlight the HINT3-HDAC1-SDHA axis as a key pathway in mitochondrial regulation, offering new insights and therapeutic targets for myocardial reperfusion injury.

Keywords: HINT3; SDHA; acetylation; mitochondrial dysfunction; myocardial ischemia/reperfusion.


Conflict of interest statement

The authors declare no conflict of interest.

Figures
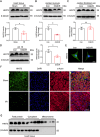
Figure 1
Figure 1
HINT3 expression is downregulated in cardiac tissue and cardiomyocytes under I/R conditions. A) Representative Western blot and quantification showing a significant decrease in HINT3 protein expression in heart tissue of C57BL/6 mice subjected to I/R surgery compared to sham group (n = 4). B) Western blot analysis of HINT3 protein levels in neonatal rat cardiomyocytes (NRCMs) exposed to OGD/R or control conditions (n = 4). C) HINT3 expression in neonatal rat cardiac fibroblasts subjected to control or OGD/R treatment (n = 4). D) Western blot and quantification of HINT3 expression in human cardiomyocyte cell line AC16 under control and OGD/R conditions (n = 4). E) Representative immunofluorescence staining showing reduced HINT3 (green) fluorescence in AC16 cells following OGD/R. Nuclei stained with DAPI (blue). Scale bar: 10 µm. F) Immunofluorescence staining of cardiac tissue sections from sham and I/R mice showing decreased HINT3 (green) expression in α‐actinin⁺ cardiomyocytes (red). Nuclei stained with DAPI (blue). Scale bar: 100 µm. G) Western blot analysis of HINT3 subcellular distribution in mouse heart tissue. (*P < 0.05).
Figure 2
Figure 2
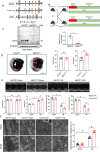
Cardiomyocyte‐specific knockout of HINT3 exacerbates myocardial I/R injury. A) Schematic diagram illustrating the generation of HINT3fl/fl mice and Cre‐loxP‐mediated HINT3 knockout (HINT3CKO) in cardiomyocytes. B) Diagram showing the experimental protocol for myocardial I/R injury (45 min ischemia followed by 24 h reperfusion). C) Western blot analysis of HINT3 expression in hearts from HINT3 cardiomyocyte‐specific knockout (HINT3CKO) mice and their HINT3fl/fl littermate controls (n = 4). D) Representative TTC/EB‐stained heart sections showing infarct areas (white), which are outlined by green dashed lines, and quantification of infarct size (IF)/area at risk (AAR) and AAR/left ventricle (LV) ratios in HINT3fl/fl and HINT3CKO mice 24 h after I/R injury (n = 6). E) Representative M‐mode echocardiography images and quantification of cardiac function, including left ventricular end‐diastolic diameter (LVIDd), left ventricular end‐systolic diameter (LVIDs), fractional shortening (FS), and ejection fraction (EF), in HINT3CKO and HINT3fl/fl mice under sham and I/R conditions (n = 10). F) Transmission electron microscopy (TEM) images showing mitochondrial ultrastructure at 3000× and 5000× magnification, and quantification of mitochondria with cristae loss in mouse hearts (n =10). Scale bars: 2 µm (3000×) and 0.5 µm (5000×).
Figure 3
Figure 3
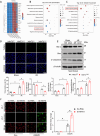
HINT3 knockout promotes apoptosis and mitochondrial dysfunction in response to I/R injury. A) Heatmap showing the expression levels of differentially expressed genes (DEGs) in cardiac tissue from HINT3fl/fl and HINT3CKO mice under I/R conditions. Each row represents a gene, and each column represents a sample, with red indicating upregulation and blue indicating downregulation of gene expression. B) Gene Ontology (GO) enrichment analysis of DEGs, highlighting biological processes such as response to chemical stimulus, multicellular organism development, response to organic substances, and regulation of biological quality. Dot size represents the number of genes, and the color gradient indicates statistical significance (‐log10 Q‐value). C) KEGG pathway enrichment analysis of DEGs, showing pathways such as PI3K‐Akt signaling, proteoglycans in cancer, focal adhesion, and JAK‐STAT signaling. Dot size corresponds to the number of genes in each pathway, and the color gradient reflects statistical significance (‐log10 Q‐value). D) TUNEL staining showing apoptotic cardiomyocytes in HINT3fl/fl and HINT3CKO hearts post‐I/R, with quantification of TUNEL‐positive cells (n = 6). Scale bar: 100 µm. E) Representative Western blot and quantitative analysis of apoptosis‐related proteins, including Bcl‐2, Bax, and cleaved caspase‐3 (C‐caspase3), in mouse hearts (n = 4). F) JC‐1 staining in AC16 cells transfected with si‐HINT3 or Sc‐RNA under OGD/R, showing impaired mitochondrial membrane potential indicated by increased green/red fluorescence ratio (n = 6), data are presented as fold change relative to OGD/R + Sc‐RNA group.
Figure 4
Figure 4
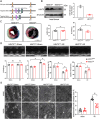
Cardiomyocyte‐specific overexpression of HINT3 alleviates myocardial I/R injury. A) Schematic representation illustrating the construction of the transgenic mouse model overexpressing HINT3 in cardiomyocytes. B) Representative Western blot analysis showing HINT3 expression in hearts of HINT3TG and HINT3NTG mice (n = 4). C) Representative TTC/EB‐stained heart sections showing infarct areas (white), which are outlined by green dashed lines, and quantification of infarct size (IF)/area at risk (AAR) and AAR/left ventricle (LV) ratios in HINT3NTG and HINT3TG mice 24 h after I/R injury (n = 6).D) Representative M‐mode echocardiography images and quantification of cardiac function, including left ventricular end‐diastolic diameter (LVIDd), left ventricular end‐systolic diameter (LVIDs), fractional shortening (FS), and ejection fraction (EF), in HINT3TG and HINT3NTG mice under sham and I/R conditions (n = 10). E) Representative transmission electron microscopy (TEM) images of myocardial ultrastructure in HINT3TG and HINT3NTG mice under sham and I/R conditions at 3000× and 5000× magnifications. Scale bars: 2 µm (3000×) and 0.5 µm (5000×).
Figure 5
Figure 5
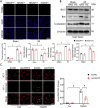
HINT3 overexpression attenuates apoptosis and preserves mitochondrial membrane potential during I/R injury. A) Representative TUNEL staining images showing apoptotic cells (green) and DAPI‐stained nuclei (blue) in cardiac tissue from HINT3NTG and HINT3TG mice under sham and I/R conditions. (n = 6). Scale bar: 100 µm. B) Representative Western blot analysis of apoptotic markers (Bcl‐2, Bax, and cleaved caspase‐3) in cardiac tissue from HINT3NTG and HINT3TG mice under sham and I/R conditions (n = 4). C) Representative JC‐1 staining images showing mitochondrial membrane potential in AC16 cardiomyocytes treated with Ad‐NC or Ad‐HINT3 under control or OGD/R conditions (n = 6), data are presented as fold change relative to OGD/R + Ad‐NC group. Scale bar: 10 µm.
Figure 6
Figure 6
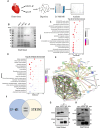
Identification of HINT3‐interacting proteins and validation of HINT3‐SDHA interaction. A) Schematic representation of the experimental workflow for identifying HINT3‐interacting proteins. B) SDS‐PAGE showing protein profiles of immunoprecipitates from heart tissue lysates. C) Bubble chart showing the top 20 significantly enriched Gene Ontology (GO) terms associated with HINT3‐interacting proteins identified by IP‐MS. D) Bubble chart showing the top 20 significantly enriched KEGG pathways associated with HINT3‐interacting proteins. E) Protein‐protein interaction network of HINT3 and its predicted interacting partners, constructed using the STRING database. F) Venn diagram showing overlapping HINT3‐interacting proteins identified by IP‐MS and STRING database predictions. G) Western blot analysis of immunoprecipitates obtained using HINT3‐specific antibodies. Co‐immunoprecipitation confirms that SDHA interacts with HINT3. H) Western blot analysis of immunoprecipitates obtained using SDHA‐specific antibodies. Co‐immunoprecipitation confirms that HINT3 interacts with SDHA.
Figure 7
Figure 7
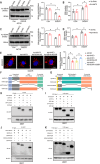
HINT3 regulates SDHA acetylation at K335, affecting SDH activity and mitochondrial ROS production. A) Representative Western blot showing acetylation levels of SDHA at K335 (Ac‐SDHA) in AC16 cardiomyocytes transfected with control (Sc‐RNA) or HINT3 knockdown (Si‐HINT3) under control (Con) and OGD/R conditions (n = 4). B) SDH enzymatic activity in AC16 cardiomyocytes transfected with Sc‐RNA or Si‐HINT3 under control and OGD/R conditions (n = 6). C) Representative Western blot showing Ac‐SDHA levels in AC16 cells infected with control adenovirus (Ad‐NC) or HINT3‐overexpressing adenovirus (Ad‐HINT3) under control and OGD/R conditions (n = 4). D) SDH enzymatic activity in AC16 cells infected with Ad‐NC or Ad‐HINT3 under control and OGD/R conditions (n = 6). E) Mitochondrial ROS levels detected by MitoSOX fluorescence in AC16 cells under OGD/R conditions treated with Ad‐NC, Ad‐HINT3, Ad‐SDHA‐NC, or Ad‐SDHA‐K335R (non‐acetylatable SDHA mutant) (n = 6). Scale bar: 10 µm. F) Schematic diagram of HINT3 full‐length (HINT3‐FL) and deletion mutants, including HINT3‐ΔN (N‐terminal deletion, 1–45aa), HINT3‐ΔHinT (HinT domain deletion, 46–149aa), and HINT3‐ΔC (C‐terminal deletion, 150–182aa), tagged with GFP. G) Schematic diagram of SDHA full‐length (SDHA‐FL) and deletion mutants, including SDHA‐ΔN (N‐terminal deletion, 1–79aa), SDHA‐ΔFADb2 (FAD‐binding domain deletion, 80–457aa), and SDHA‐ΔC (C‐terminal deletion, 458–664aa), tagged with HA. H) Co‐immunoprecipitation (Co‐IP) of HA‐tagged SDHA‐FL with GFP‐tagged HINT3 mutants in HEK293T cells. I) Western blot analysis of inputs and Co‐IP samples from (H), demonstrating successful expression of all GFP‐ and HA‐tagged proteins. J) Co‐IP of GFP‐tagged HINT3‐FL with HA‐tagged SDHA mutants in HEK293T cells. K) Western blot analysis of inputs and Co‐IP samples from (J), confirming successful expression of all GFP‐ and HA‐tagged proteins.
Figure 8
Figure 8
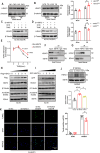
HINT3 regulates HDAC1 expression and competes with HDAC1 for SDHA binding in a disease‐dependent manner. A) Representative Western blot showing HDAC1 expression in heart tissues from HINT3fl/fl and HINT3CKO mice under sham and I/R conditions (n = 4). B) Representative Western blot showing HDAC1 expression in heart tissues from HINT3NTG and HINT3TG mice under sham and I/R conditions (n = 4). C–E) CHX chase assay in AC16 cells under OGD/R conditions, showing HDAC1 protein stability after HINT3 knockdown (n = 4). F,G) Co‐IP showing interaction between SDHA and HDAC1 in mouse heart tissue. H,I) Western blots of SDHA K335 acetylation in AC16 cells with gradient overexpression of Flag‐HDAC1 (H) or GFP‐HINT3 (I) under normoxia. J) Co‐IP of SDHA‐bound HDAC1 in AC16 cells under OGD/R with control, HINT3 knockdown, or overexpression (n = 4). K) TUNEL staining of AC16 cells under control or OGD/R conditions with HINT3 knockdown and HDAC1 knockdown (n = 6). Scale bar: 50 µm.

References

    1. Welt F. G. P., Batchelor W., Spears J. R., Penna C., Pagliaro P., Ibanez B., Drakos S. G., Dangas G., Kapur N. K., Journal of the American College of Cardiology 2024, 83, 2196. - PubMed
    1. Prag H. A., Aksentijevic D., Dannhorn A., Giles A. V., Mulvey J. F., Sauchanka O., Du L., Bates G., Reinhold J., Kula‐Alwar D., Xu Z., Pellerin L., Goodwin R. J. A., Murphy M. P., Krieg T., Circ. Res. 2022, 131, 528. - PMC - PubMed
    1. Hansen P. R., Circulation 1995, 91, 1872. - PubMed
    1. Gonnot F., Boulogne L., Brun C., Dia M., Gouriou Y., Bidaux G., Chouabe C., Da Silva C. C., Ducreux S., Pillot B., Kaczmarczyk A., Leon C., Chanon S., Perret C., Sciandra F., Dargar T., Gache V., Farhat F., Sebbag L., Bochaton T., Thibault H., Ovize M., Paillard M., Gomez L., Nat. Commun. 2023, 14, 3346. - PMC - PubMed
    1. Ma L., Zou R., Shi W., Zhou N., Chen S., Zhou H., Chen X., Wu Y., Theranostics 2022, 12, 5034. - PMC - PubMed

Substances

LinkOut - more resources