. 2025 Oct;12(38):e06209.
doi: 10.1002/advs.202506209. Epub 2025 Aug 4.

Endothelial-Derived CCL7 Promotes Macrophage Polarization and Aggravates Septic Acute Lung Injury via CCR1-Mediated STAT1 Succinylation

Affiliations

Endothelial-Derived CCL7 Promotes Macrophage Polarization and Aggravates Septic Acute Lung Injury via CCR1-Mediated STAT1 Succinylation

Xue Li et al. Adv Sci (Weinh). 2025 Oct.

Abstract

Acute lung injury (ALI) is a significant complication of sepsis, wherein the interaction between pulmonary vascular endothelial cells and immune cells plays a pivotal role in the pathogenesis. In this study, it is demonstrated that secretion of chemokine C-C motif ligand 7 (CCL7) by endothelial cells (ECs) induces metabolic reprogramming and M1 polarization of C-C motif chemokine receptor 1-positive (CCR1⁺) macrophages. It is noteworthy that mice with specific inhibition of endothelial-derived CCL7 exhibit reduced severity of septic ALI, underscoring the critical role of CCL7 in the progression of sepsis. Mechanistically, activation of the CCL7-CCR1 axis enhances STAT1 succinylation through upregulation of KAT2A expression, leading to increased STAT1 binding to the promoter of glycolytic genes in macrophages. This epigenetic regulation modulates metabolic reprogramming and M1 polarization of macrophages, thereby driving inflammatory cascades in septic ALI. Furthermore, in sepsis models, Ccr1-knockout (Ccr1-KO) mice demonstrate attenuated lung inflammation and decreased mortality, highlighting the therapeutic potential of targeting the CCL7-CCR1 axis for the treatment of septic ALI. Collectively, findings provide novel insights into the metabolic reprogramming of macrophages and identify the CCL7-CCR1 axis as a promising therapeutic target for septic ALI.

Keywords: CCL7; glycolysis; macrophage; sepsis; succinylation.


Conflict of interest statement

The authors declare no conflicts of interest.

Figures
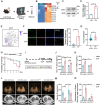
Figure 1
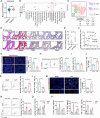
Figure 1
Inhibition of endothelial‐derived CCL7 improves septic ALI. A) Schematic diagram of the magnetic bead‐based sorting process for isolating ECs from the lung tissue of C57BL/6 mice. B) Heatmap illustrating the expression levels of classical chemokines derived from RNA sequencing data of ECs treated with or without LPS (10 µg mL−1) for 24 h (n = 3). C) Western blot analysis of CCL7 protein expression in ECs treated with or without LPS for 24 h. D) Relative mRNA expression of CCL7 in ECs treated with or without LPS for 24 h (n = 3). E) Dot plot showing the expression of CCL7 across all subclusters, visualized on the t‐SNE dimensionality reduction plot. F) Representative immunofluorescence co‐staining of CD31 (green) and CCL7 (red) in lung sections from the sham and CLP mice (scale bars: 50 µm). G) Analysis of CCL7 expression in whole‐blood RNA sequencing data from sepsis survivors (S, n = 95) and non‐survivors (NS, n = 31) in the GSE54514 database. H) Kaplan‐Meier survival curve comparing patients with high CCL7 expression versus low CCL7 expression in the GSE54514 database. I) Schematic diagram outlining the experimental design used to evaluate the efficacy of intratracheal delivery of AAV6‐Tie2‐EGFP‐shCcl7 in a mouse sepsis model. J, K) Serum (J) and BALF (K) CCL7 concentrations in AAV‐vector and AAV‐Ccl7‐KD mice with or without sepsis (n = 6). L) 3D imaging and CT scans of lungs from AAV‐vector and AAV‐Ccl7‐KD mice with or without sepsis. M) Quantification of micro‐CT‐derived non‐aerated lung volume as an indicator of lung consolidation (n = 6). N) Assessment of lung transvascular permeability by measuring Evans blue dye leakage in micrograms per gram of lung tissue in AAV‐vector and AAV‐Ccl7‐KD mice with or without sepsis (n = 6). Data are presented as mean ± SD, * p < 0.05, ** p < 0.01. Data in D, F, and G were analyzed by two‐tailed Student's t‐test. Data in H were analyzed by the Log‐rank test. Data in J, K, M, and N were analyzed by two‐way ANOVA with Tukey's post hoc test.
Figure 2
Figure 2
CCL7 regulates infiltration and inflammation of CCR1+ macrophages. A) Comparison of the proportions of neutrophil infiltration in patients with sepsis based on median CCL7 expression levels in the GSE54514 database. B) Immune cell proportions deconvoluted by CIBERSORT analysis for the CCL7‐low and CCL7‐high groups derived from RNA sequencing data of ECs (n = 3). C) t‐SNE plot illustrating the transcriptional identity of macrophages analyzed by single‐cell sequencing data. Annotations of cell clusters were shown (upper panel). The percentages of each macrophage subtype in the sham and CLP mice were presented (lower panel). D) Histopathological characterization using H&E and Masson staining along with immunohistochemical quantification of CD86+ macrophages (M1) and endothelial CCL7 expression (scale bars: 50 µm). E) Paired analysis of CCL7 expression in M1‐poor and M1‐rich areas (n = 10). F) Pearson correlation matrix assessing the relationship between CCL7 expression and CD86 expression (n = 20). G) Fluorescence imaging of lung tissue sections from AAV‐vector and AAV‐Ccl7‐KD septic mice transfused with PKH26‐labeled BMDMs. The number of PKH26‐labeled BMDMs per field was quantified (scale bars: 200 µm, n = 6). H, I) Proportions of the CD86+ M1 macrophages (H) or CD206+ M2 (I) macrophages among the PKH26‐labeled BMDMs in the lung tissue of AAV‐vector and AAV‐Ccl7‐KD septic mice (n = 6). J) Proportion of CCR1+ IMs in the lung tissue of sham and CLP mice (n = 6). K, L) Proportions of the CD86+ M1 macrophages (K) or CD206+ M2 macrophages (L) among the CCR1+ IMs in the lung tissue of sham and CLP mice (n = 6). M) Representative immunofluorescence co‐localization of CCR1 (green) and CD86 (red) in lung sections from sham and CLP mice. The numbers of double‐positive (CCR1+CD86+) cells per field were quantified (arrows indicate double‐positive cells; scale bars: 50 µm, n = 6). N, O) Proportions of the CD86+ M1 macrophages (N) or CD206+ M2 macrophages (O) among the CCR1+ IMs in the lung tissue of AAV‐vector and AAV‐Ccl7KD mice with or without sepsis (n = 6). P) Concentrations of IL‐1β, IL‐6, and TNF‐α in the BALF of AAV‐vector and AAV‐Ccl7‐KD mice with or without sepsis (n = 6). Data are presented as mean ± SD, ns, nonsignificant. * p < 0.05, ** p < 0.01, *** p < 0.001. Data in A, E, and G‐M were analyzed by two‐tailed Student's t‐test. Data in B were analyzed by the Wilcoxon rank sum test. Data in N‐P were analyzed by two‐way ANOVA with Tukey's post hoc test.
Figure 3
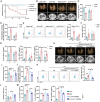
Figure 3
CCR1+ macrophages play a crucial role in septic ALI. A) Kaplan‐Meier survival curve comparing WT and Ccr1‐KO mice with or without sepsis (n = 10). B) 3D imaging and CT scans of lungs from WT and Ccr1‐KO mice with or without sepsis. C) Quantification of micro‐CT‐derived non‐aerated lung volume as an indicator of lung consolidation (n = 5/6). D) Assessment of lung transvascular permeability by measuring Evans blue dye leakage in micrograms per gram of lung tissue in WT and Ccr1‐KO mice with or without sepsis (n = 5). E, F) Proportions of the CD86+ M1 macrophages (E) or CD206+ M2 macrophages (F) among the IMs in lung tissue of WT and Ccr1‐KO mice with or without sepsis (n = 5). G) Concentrations of IL‐1β, IL‐6, and TNF‐α in the BALF of WT and Ccr1‐KO mice with or without sepsis (n = 6). H) 3D imaging and CT scans of lungs in the indicated groups. I) Quantification of micro‐CT‐derived non‐aerated lung volume as an indicator of lung consolidation (n = 5). J) Assessment of lung transvascular permeability by measuring Evans blue dye leakage in micrograms per gram of lung tissue in the indicated groups (n = 6). K, L) Proportions of the CD86+ M1 macrophages (K) or CD206+ M2 macrophages (L) among the IMs in the lung tissue of the indicated groups (n = 6). M) Concentrations of IL‐1β, IL‐6, and TNF‐α in the BALF of the indicated groups (n = 6). Data are presented as mean ± SD, * p < 0.05, ** p < 0.01. Data in A were analyzed by the Log‐rank test. Data in C were analyzed by two‐way ANOVA with Scheffe's post hoc test. Data in D‐G were analyzed by two‐way ANOVA with Tukey's post hoc test. Data in I‐M were analyzed by one‐way ANOVA with Tukey's post hoc test.
Figure 4
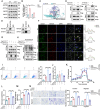
Figure 4
The CCL7–CCR1 axis regulates macrophage polarization via STAT1 activation. A) WT and Ccr1‐KO BMDMs were treated with or without rmCCL7 (100 ng mL−1) for 24 h. B) Concentrations of IL‐1β, IL‐6, and TNF‐α in the supernatants of WT and Ccr1KO BMDMs treated with or without rmCCL7 (n = 3). C) Proportions of the M1 macrophages among the WT and Ccr1‐KO BMDMs treated with or without rmCCL7 (n = 3). D) GSEA was performed on rmCCL7‐treated BMDMs, revealing enrichment scores (ESs) for the citrate cycle and oxidative phosphorylation pathways. E‐G) ECAR in WT and Ccr1KO BMDMs with or without rmCCL7 (n = 5). H) GSEA was conducted on rmCCL7‐treated BMDMs, revealing ES for the JAK‐STAT signaling pathway. I) Western blot analysis of STAT1 and p‐STAT1 expression in WT and Ccr1KO BMDMs treated with or without rmCCL7. The values were normalized to those of the control group (n = 3). J) Proportion of the M1 macrophages in the indicated groups (n = 3). K) Invasion and migration abilities of BMDMs in the indicated groups (scale bar: 100µm, n = 3). L‐N) ECAR in the indicated groups (n=5). Data are presented as mean ± SD, * p < 0.05, ** p < 0.01. Data in B, C, F, G, and I were analyzed by two‐way ANOVA with Tukey's post hoc test. Data in J, K, M, and N were analyzed by one‐way ANOVA with Tukey's post hoc test.
Figure 5
Figure 5
Metabolic reprogramming in macrophages is dependent on STAT1‐K665 succinylation. A) Lysine succinylation proteomics identifying the STAT1‐K665 modification site via LC‐MS/MS. B) Identification of STAT1 succinylation sites in BMDMs transfected with the STAT1‐WT, STAT1‐K388R, and STAT1‐K665R plasmids. Succinylation was immunoprecipitated and detected by immunoblotting for Flag. C) Schematic representation of the STAT1 domain structure and alignment of STAT1 orthologs, with the succinylated residue (K665) highlighted in red. D‐F) ECAR in the STAT1‐WT, STAT1‐K388R, and STAT1‐K665R BMDMs treated with or without rmCCL7 (n = 5). G) Western blot analysis of STAT1 and p‐STAT1 expression in STAT1‐WT, STAT1‐K665R, and STAT1‐K665E BMDMs. The values were normalized to those of the STAT1‐WT group (n = 3). H, I) Proportions of the CD86+ M1 macrophages (H) or CD206+ M2 macrophages (I) among the BMDMs in the STAT1‐WT, STAT1‐K665R, and STAT1‐K665E groups (n = 3). J‐L) ECAR in the STAT1‐WT, STAT1‐K665R, and STAT1‐K665E groups (n = 5). M) Invasion and migration abilities of BMDMs in the STAT1‐WT, STAT1‐K665R, and STAT1‐K665E groups (scale bar: 100µm, n = 3). N) Immunoprecipitation analysis of STAT1 ubiquitination in HEK293T cells transiently transfected with HA‐ubiquitin (Ub), FLAG‐STAT1‐WT, and Flag‐STAT1‐K665R, with or without succinyl‐CoA treatment. O) 3D imaging and CT scans of lungs from septic mice transfused with the STAT1‐WT, STAT1‐K665R, and STAT1‐K665E groups. P) Quantification of micro‐CT‐derived non‐aerated lung volume as an indicator of lung consolidation volume (n = 6). Q) Assessment of lung transvascular permeability by measuring Evans blue dye leakage in micrograms per gram of lung tissue in the STAT1‐WT, STAT1‐K665R, and STAT1‐K665E groups (n = 6). R) Concentrations of IL‐1β, IL‐6, and TNF‐α in the BALF of septic mice transfused with the STAT1‐WT, STAT1‐K665R, and STAT1‐K665E BMDMs (n = 6). S. Proportions of the PKH26‐labeled BMDMs in the lung tissue of septic mice transfused with the STAT1‐WT, STAT1‐K665R, and STAT1‐K665E BMDMs (n = 5/6). T, U) Proportions of the CD86+ M1 macrophages (T) or CD206+ M2 macrophages (U) among the PKH26‐labeled BMDMs in the lung tissue of septic mice transfused with the STAT1‐WT, STAT1‐K665R, and STAT1‐K665E BMDMs (n = 5/6). Data are presented as mean ± SD, * p < 0.05, ** p < 0.01. Data in E‐I, K, M, and P‐R were analyzed by one‐way ANOVA with Tukey's post hoc test. Data in S‐U were analyzed by one‐way ANOVA with Scheffe's post hoc test.
Figure 6
Figure 6
The CCL7–CCR1 axis upregulates KAT2A to drive STAT1 succinylation. A) Western blot analysis of KAT2A, CPT1A, SIRT5, and SIRT7 protein levels in WT and Ccr1‐KO BMDMs treated with or without rmCCL7 for 24 h. B) Relative mRNA expression of KAT2A in WT and Ccr1‐KO BMDMs treated with or without rmCCL7 for 24 h (n = 3). C) Structural model of KAT2A (purple) binding to STAT1 (blue), highlighting key interacting residues (red sticks) and the interface area (3855.2 Å2). The predicted binding energy (ΔiG = −2.2 kcal mol−1) indicated a stable interaction. D) Interaction between HA‐tagged KAT2A and Flag‐tagged STAT1 was assessed in HEK293T cells co‐transfected to overexpress these proteins. The interaction was analyzed in whole cell lysates (WCLs) and after immunoprecipitation with anti‐Flag or anti‐HA beads. E) Endogenous interaction between KAT2A and STAT1 was determined by co‐immunoprecipitation in BMDM lysates. F) Representative immunofluorescence images of STAT1 (red) and KAT2A (green) localization in the WT and Ccr1‐KO BMDMs treated with or without rmCCL7 for 24 h. The right panel showed the results of the co‐localization analysis (scale bars: 50 µm). G) Immunoblot analysis of succinylated STAT1 in HEK293T cells transfected with Flag‐STAT1‐WT or Flag‐STAT1‐K665R, with or without HA‐KAT2A. H) Immunoblot analysis of ubiquitinated STAT1 in HEK293T cells transfected with Flag‐STAT1‐WT or Flag‐STAT1‐K665R, with or without HA‐KAT2A. I, J) Proportion of the CD86+ M1 macrophages (I) or CD206+ M2 macrophages (J) among the BMDMs in the indicated groups (n = 3). K‐M) ECAR in the indicated groups (n = 5). N) Invasion and migration abilities of BMDMs in the indicated groups (scale bar: 100µm, n = 3). Data are presented as mean ± SD, * p < 0.05, ** p < 0.01. Data in I, J, and L‐N were analyzed by one‐way ANOVA with Tukey's post hoc test.
Figure 7
Figure 7
The binding of STAT1 to the promoter region of glycolytic genes is increased by succinylation. A) Heat map visualization of STAT1 CUT&Tag signal intensity profiles in between the BMDMs treated with or without rmCCL7, ranked by the magnitude of differential chromatin accessibility peaks. B) Genomic annotations of peaks by chromosome region (upper). The discovered motifs are enriched in the promoters of glycolysis‐related transcription factors (lower). C) Overlap analysis of differentially enriched STAT1‐binding peaks, differentially expressed genes in BMDMs treated with or without rmCCL7, and glycolysis‐associated gene clusters. D) Genome browser tracks illustrating STAT1 transcriptional binding patterns at loci of glycolytic enzymes (GCK, PFKL, HK1, HK2, LDHB, and SLC2A1) in BMDMs treated with or without rmCCL7. Promoter regions are demarcated by gray shading. E) Dual‐luciferase assay after the transfection with the indicated plasmids. F) Quantification of the abundance of STAT1 peaks at the promoters of glycolytic genes in the indicated groups (n = 3). G) Relative mRNA levels of HK1, LDHB, and SLC2A1 in the indicated groups (n = 3). H) Western blot analysis of HK1, LDHB, and SLC2A1 expression in the indicated groups. Data are presented as mean ± SD, * p < 0.05, ** p < 0.01. Data in E‐G were analyzed by one‐way ANOVA with Tukey's post hoc test.
Figure 8
Figure 8
During sepsis, pulmonary vascular endothelial cells secrete chemokine CCL7, which plays a pivotal role in facilitating the infiltration of C‐C motif chemokine receptor 1‐positive (CCR1+) macrophages into lung tissue. Activation of the CCL7–CCR1 axis enhances the succinylation of STAT1 mediated by KAT2A, thereby driving metabolic reprogramming and promoting M1 polarization of macrophages. These findings elucidate the interaction between pulmonary vascular endothelial cells and macrophages in the pathogenesis of acute lung injury (ALI) during sepsis, offering novel insights and potential therapeutic targets for the treatment of septic ALI.

References

    1. Rezoagli E., Fumagalli R., Bellani G., Ann. Transl. Med. 2017, 5, 282. - PMC - PubMed
    1. Parotto M., Gyongyosi M., Howe K., Myatra S. N., Ranzani O., Shankar‐Hari M., Herridge M. S., Lancet Respir Med 2023, 11, 739. - PubMed
    1. Meyer N. J., Prescott H. C., N. Engl. J. Med. 2024, 391, 2133. - PubMed
    1. Zhang J., Wang T., Wang Y., Li Y., Wang L., Wang J., Miao Y., Xu F., Yao Y., Cell Rep. 2025, 44, 115571. - PubMed
    1. Puneet P., Moochhala S., Bhatia M., Am J Physiol Lung Cell Mol Physiol 2005, 288, L3. - PMC - PubMed

MeSH terms

LinkOut - more resources