. 2025 Jun 9:10:49.
doi: 10.21037/tgh-24-124. eCollection 2025.

Development and validation of a machine learning-based nomogram for preoperative prediction of laparoscopic surgical difficulty in gallstone patients

Affiliations

Development and validation of a machine learning-based nomogram for preoperative prediction of laparoscopic surgical difficulty in gallstone patients

Kun Huang et al. Transl Gastroenterol Hepatol. .

Abstract

Background: Preoperative prediction of laparoscopic surgical difficulty in gallstone patients is crucial for improving surgical outcomes. This study aimed to develop and validate a nomogram based on advanced machine learning algorithms, incorporating key clinical and systemic inflammatory response indicators, such as the C-reactive protein to albumin ratio (CAR).

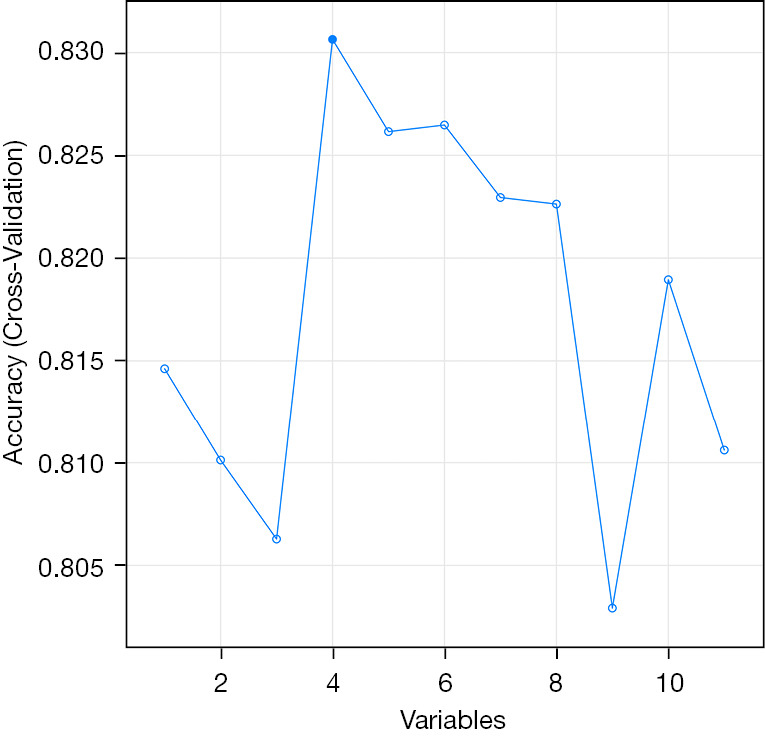
Methods: A retrospective analysis was conducted on 362 eligible patients who underwent laparoscopic cholecystectomy (LC) for gallstones between 2013 and 2019. A total of 420 patients were initially identified, with 58 excluded based on predefined criteria such as age and incomplete records. The remaining patients were divided into a training set (n=253) and a validation set (n=109). The development of the nomogram involved multiple analytical techniques, including machine learning methods such as least absolute shrinkage and selection operator (LASSO) regression, decision tree analysis, and support vector machine (SVM) models, along with traditional statistical methods like univariate and multivariate logistic regression. Significant predictors, including CAR, white blood cell count (WBC), and gallbladder wall thickness, were integrated into the final predictive model. Model performance was evaluated using receiver operating characteristic (ROC) curve analysis and calibration plots.

Results: The machine learning-based model demonstrated strong predictive capability, with an area under the curve (AUC) of 0.774 in the training set and 0.863 in the validation set. Calibration plots showed good agreement between predicted and actual outcomes, with mean absolute errors of 0.035 and 0.05 for the training and validation sets, respectively.

Conclusions: This study demonstrates the utility of applying machine learning algorithms to develop a robust nomogram for preoperative prediction of laparoscopic surgical difficulty. By integrating key clinical variables and systemic inflammatory markers, the model provides an effective tool for improving surgical planning and enhancing patient outcomes.

Keywords: Laparoscopic surgery; machine learning; nomogram; preoperative prediction; systemic inflammatory response.


Conflict of interest statement

Conflicts of Interest: All authors have completed the ICMJE uniform disclosure form (available at https://tgh.amegroups.com/article/view/10.21037/tgh-24-124/coif). The authors have no conflicts of interest to declare.

Figures

Figure 1
Figure 1
Flow chart of participant selection and categorization. This flow chart summarizes the process of participant selection and exclusion, starting from the initial 420 patients identified, down to the final 362 eligible patients. Key exclusion criteria were age (<18 or >85 years), presence of multiple primary conditions, incomplete records, and lack of consent, resulting in the exclusion of 58 patients. The remaining participants were divided into a training set (n=253) and a validation set (n=109), with the further breakdown of easy and difficult surgeries in each group. The chart provides a clear visual representation of how participants flowed through the different stages of the study.
Figure 2
Figure 2
LASSO regression analysis for variable selection. It shows the results of the LASSO regression analysis, used for selecting the most significant predictors in the model for surgical difficulty in patients with gallstones. (A) The coefficient profiles of the variables as a function of the regularization parameter, log(λ). Each curve represents a different variable, and as log(λ) increases (moving left to right), coefficients shrink towards zero, demonstrating the penalization effect. The variables with non-zero coefficients at higher log(λ) values are considered the most significant predictors. (B) The AUC performance as a function of log(λ). The red dots represent the AUC values, while the gray error bars indicate the standard errors. The vertical dashed line marks the log(λ) value where the AUC is maximized, reflecting the optimal balance between model complexity and predictive accuracy. AUC, area under the curve; LASSO, least absolute shrinkage and selection operator.
Figure 3
Figure 3
Optimal variable selection in SVM model. The figure presents the cross-validation accuracy of the SVM model across different numbers of variables used in the prediction. The X-axis denotes the number of variables included in the model, ranging from 1 to 10, and the Y-axis represents the model’s accuracy during cross-validation. The highest accuracy, 0.830, is observed when 4 variables are used. The accuracy shows fluctuations as more variables are incorporated, with a sharp decline at 8 variables. The accuracy slightly improves with additional variables but remains below the peak achieved with 4 variables. SVM, support vector machine.
Figure 4
Figure 4
A decision tree model used to predict surgical difficulty in patients with gallstones, based on key clinical variables. The tree structure illustrates the sequential decision-making process, starting with the WBC as the primary node. Subsequent splits are based on CAR and gallbladder wall thickness, which further refine the prediction. The decision tree begins at the root node with WBC, where patients are divided into two groups based on whether their WBC is less than or greater than or equal to 8.055. Patients with a WBC of less than 8.055 generally fall into Node 2, which predominantly predicts an easy surgery (with a large proportion of outcomes labeled “0”). Those with higher WBC values are further split based on CAR levels, with those having a CAR of 0.108 or higher being further divided by gallbladder wall thickness. The terminal nodes, Nodes 6 and 7, represent the most refined predictions, showing that patients with higher CAR and gallbladder wall thickness greater than 2 mm are more likely to experience surgical difficulty (indicated by a larger proportion of outcomes labeled “1” in Node 7). CAR, C-reactive protein to albumin ratio; WBC, white blood cell count.
Figure 5
Figure 5
A nomogram developed to predict the likelihood of surgical difficulty in patients with gallstones. The nomogram integrates several clinical variables to estimate the probability of a difficult surgery. The variables included are CAR, NLR, WBC, liver function score, gallbladder wall thickness, the clarity of Calot’s triangle, and age. Each variable is plotted along a line, where specific ranges or categories of the variable correspond to different point values. These points are then summed to give a total score, which is mapped to the prediction rate at the bottom of the nomogram. This prediction rate indicates the probability of surgical difficulty, allowing clinicians to assess preoperative risk more accurately. CAR, C-reactive protein to albumin ratio; NLR, neutrophil-to-lymphocyte ratio; WBC, white blood cell count.
Figure 6
Figure 6
ROC curves for two predictive models assessing surgical difficulty in patients with gallstones. The ROC curve plots sensitivity (true positive rate) against 1-specificity (false positive rate) to evaluate the model’s discriminative ability. (A) The ROC curve for the initial predictive model, with an AUC of 0.774; (B) the ROC curve for a refined model, which achieved a higher AUC of 0.863, indicating improved performance in distinguishing between easy and difficult surgeries. AUC, area under the curve; ROC, receiver operating characteristics.
Figure 7
Figure 7
Calibration curves for the predictive model assessing surgical difficulty in patients with gallstones. Calibration curves evaluate the agreement between predicted probabilities and actual outcomes. The dashed diagonal line represents the ideal calibration, where predictions perfectly match the actual outcomes. The solid red line represents the model’s calibration after adjustment, and the dotted blue line shows the original calibration. (A) The calibration curve for the training set, with a mean absolute error of 0.035, indicating a good fit between the predicted and actual probabilities. (B) The calibration curve for the validation set, with a slightly higher mean absolute error of 0.05, but still demonstrating acceptable agreement between the predictions and actual outcomes.
Figure 8
Figure 8
Decision curve analysis for three predictive models across the training set (A) and validation set (B). The models are assessed based on their net benefit across a range of high-risk thresholds. Model A, which incorporates features related to Calot’s triangle and gallbladder wall thickness, is shown in red. Model B, which uses WBC as a predictor, is depicted in blue. Model C, the comprehensive nomogram, is represented in orange. The lines labeled “All” and “None” serve as references, indicating the net benefit if all or no variables are treated based on the predicted risk. WBC, white blood cell count.

Similar articles

References

    1. Cuschieri A. Laparoscopic cholecystectomy. J R Coll Surg Edinb 1999;44:187-92. - PubMed
    1. Keus F, de Jong JA, Gooszen HG, et al. Laparoscopic versus open cholecystectomy for patients with symptomatic cholecystolithiasis. Cochrane Database Syst Rev 2006;(4):CD006231. 10.1002/14651858.CD006231 - DOI - PubMed
    1. Soper NJ, Stockmann PT, Dunnegan DL, et al. Laparoscopic cholecystectomy. The new 'gold standard'? Arch Surg 1992;127:917-21; discussion 921-3. 10.1001/archsurg.1992.01420080051008 - DOI - PubMed
    1. Kalata S, Thumma JR, Norton EC, et al. Comparative Safety of Robotic-Assisted vs Laparoscopic Cholecystectomy. JAMA Surg 2023;158:1303-10. 10.1001/jamasurg.2023.4389 - DOI - PMC - PubMed
    1. Humm GL, Peckham-Cooper A, Chang J, et al. Surgical experience and identification of errors in laparoscopic cholecystectomy. Br J Surg 2023;110:1535-42. 10.1093/bjs/znad256 - DOI - PMC - PubMed

LinkOut - more resources